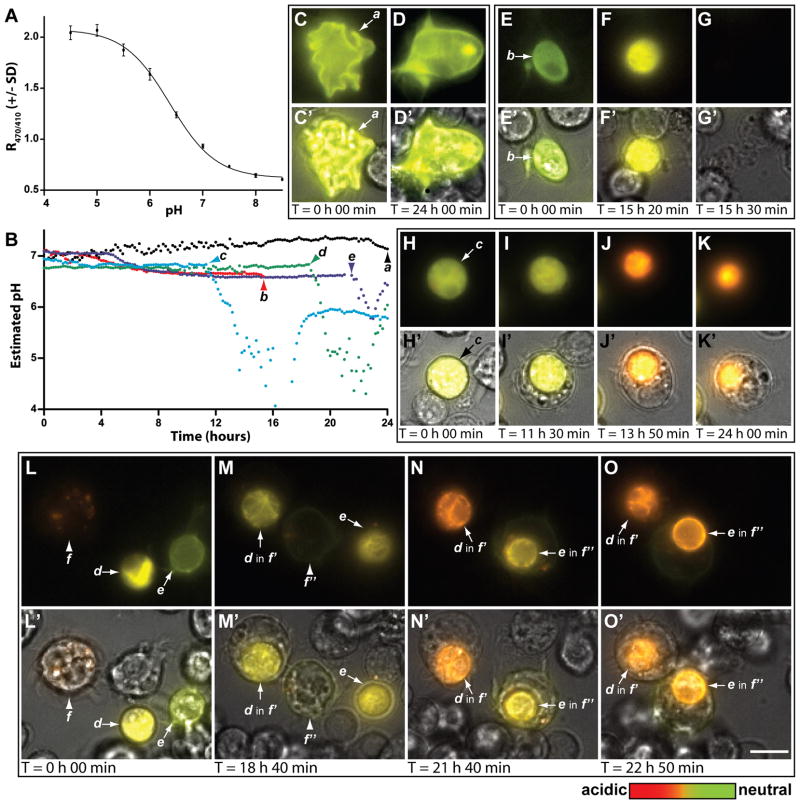
Fig. 2.
pHMA acidifies after cell engulfment in S2 cells. A: Standard R470/410 curve generated by fixing and buffering S2R+ pHMA-expressing cells. The average R470/410 and standard deviations (see methods) are plotted against pH. B: pH estimates for cells “a” to “e” derived from the curve fit in A. C–O: Wide-field fluorescence images of cells from time-lapse movies; emission at excitation of 410 nm is green and at excitation of 470 nm is red. C′–O′: Fluorescence images are overlaid with transmitted light images to reveal unlabeled cells in the field. C–D, C′–D′: Morphologically healthy cell has cortical expression of pHMA, cell “a” (arrow). E–G, E′–G′: Dying cell “b” (arrow) acidifies slightly (green->yellow); fluorescence disappears. H–K, H′–K′: Cell “c” acidifies slightly and then acidifies substantially after engulfment and persists for many hours as a strongly acidified, but shrinking vesicle. L–O, L′–O′: Cells “d” and “e” acidify slightly and then acidify substantially after engulfment by “ f′ ” and “ f″ ”, the daughter cells of “ f ”. Notice that the pH of d and e’s engulfed corpses rebounds over time. Scale bar is 10 μm.

