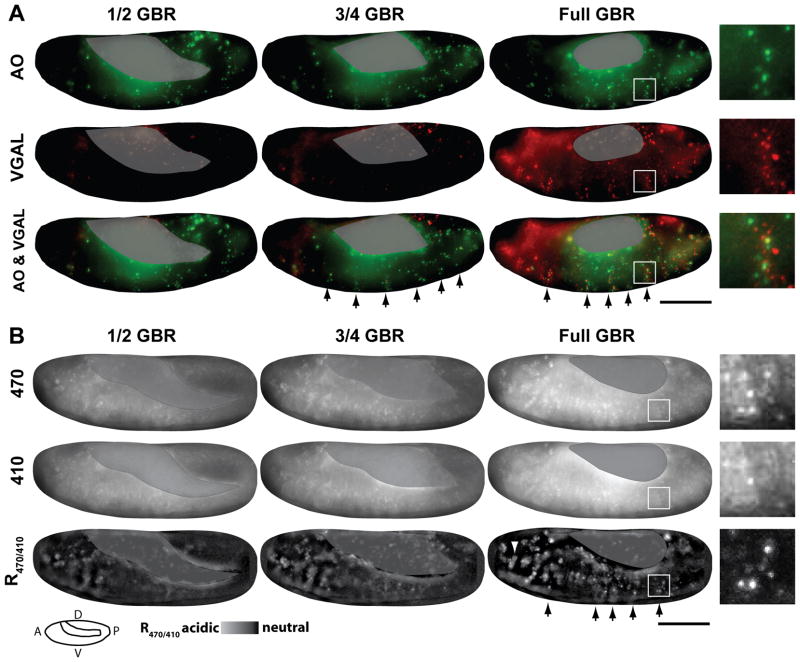
Fig. 3.
The pattern of pHMA acidification mimics VGAL, a known cell engulfment marker. Shown here are images from time-lapse recordings of embryos at ½, ¾, and full germ band retraction (GBR). A: Shows a wild-type embryo injected with AO (green) and VGAL (red). The images are maximum intensity projections of three 5 μm optical sections. B: Shows a UAS-pHMA embryo that was injected with GAL4VP16 protein to induce uniform pHMA expression. Emission of pHMA collected with an FITC filter, when excited by 470 nm and 410 nm, and ratio image of the above signals (R470/410). These images are maximum intensity projections of ten 1 μm optical sections. The R470/410 ratio images were generated by subtracting the background from the 470 and 410 nm images as described in the methods section. Yolk auto-fluorescence is masked with a grey overlay. The segmentally repeated pattern of cell death is indicated by the arrows. Enlarged views of a single segment of dying cells are shown as insets. A cluster of macrophages that contains acidified pHMA is indicated by an arrowhead. Wide-field images were acquired with a 20X lens; lateral view; anterior, left; ventral, down; scale bar is 100 μm.

