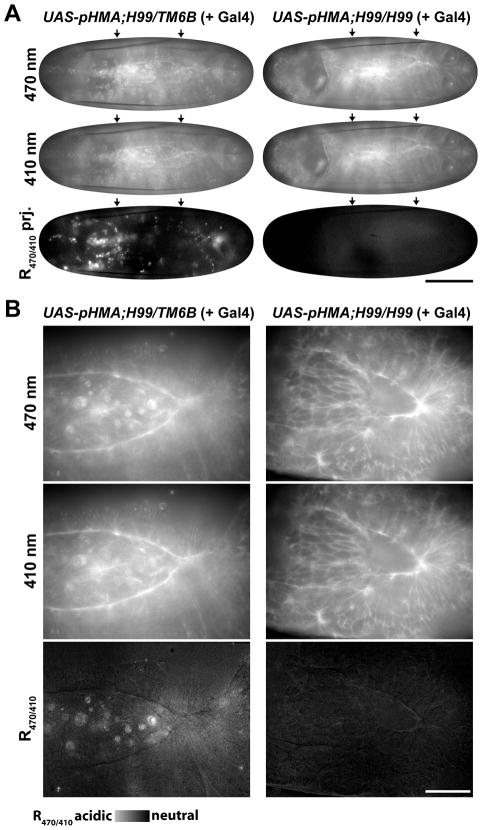
Fig.6.
Cell-death-deficient embryos with normal autophagy show no pHMA acidification. Shown here are images captured with 470 nm and 410 nm excitation and R470/410 images of UAS-pHMA; H99/TM6B (or UAS-pHMA; TM6B/TM6B) (left column) and UAS-pHMA;H99/H99 (right column) embryos. Dorsal view, images from time-lapse series at >50% dorsal closure. A: Single focal planes of images captured with 470 nm and 410 nm excitation. Maximum intensity projections of five focal planes at the surface of the embryo taken 2 μm apart showing R470/410 ratio. Arrows indicate the anterior-posterior limits of the dorsal opening. Images were acquired with 20X lens; scale bar is 100 μm. B. Single focal plane; 60X images; scale bar is 30 μm.

