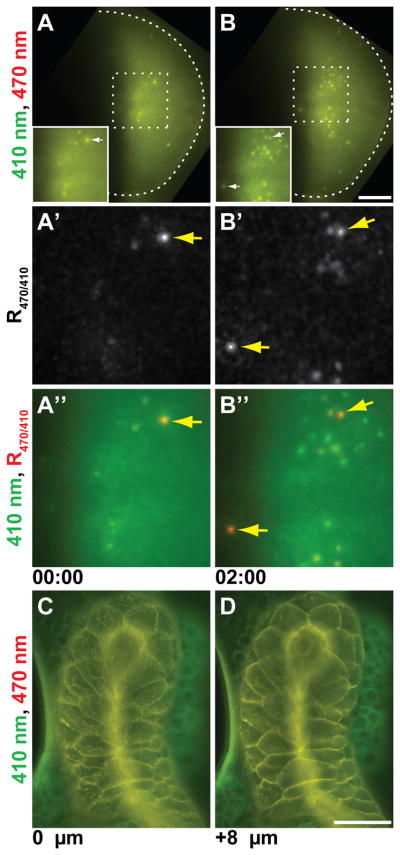
Fig 9.
pHMA expression in salivary glands and wing imaginal discs. A and B: pHMA expression in engrailed-positive cells in the wing pouch of a larval imaginal disc. Maximum projection images of ten 2 μm optical sections extracted from a time-lapse movie are shown at two time points, two hours apart. The images captured with 410 nm excitation are displayed in green and 470 nm are in red. The arrows point to cellular material that show strong acidification. The scale bar is 30 μm. A′ and B′: Show magnified R470/410 ratio images of the insets in A and B. A″ and B″: Shows the same region as A′ and B′ with the 410 nm fluorescence signal in green overlayed with the R470/410 image in red. C and D: Shows Ubi-pHMA expression in a larval salivary gland. The images are surface (C) and subsurface (D) sections of a single time point. The 410 nm fluorescence signal is displayed in green and 470 nm is in red. Scale bar is 100 μm.

