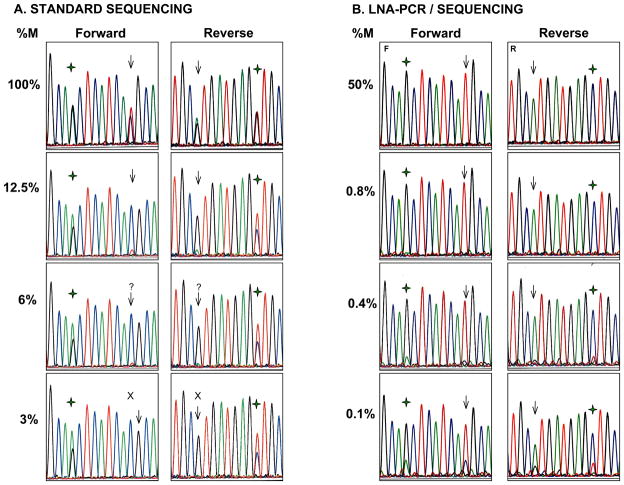
Figure 3.
Representative electropherograms of the sensitivity study for EGFR T790M. A. Sequencing after standard PCR of undiluted mutant DNA (100%) shows both a mutant peak (T) and a WT peak (C) at position 2369 (arrow) at roughly the same proportions. Serial dilutions of mutant DNA with normal control DNA show a sequential decrease in size of the mutant peak. The mutation is clearly seen at dilutions of 12.5% or higher in both the forward and reverse directions. Below this level, the mutant peak is at the level of the background or completely absent. % M denotes percent of mutant DNA; ( ) denotes SNP at position 2361. B. LNA-PCR/sequencing. With the introduction of the LNA probe, only the mutant peak (T) is seen at position 2369 (arrow) at all dilutions of 0.8% and above. At progressively lower concentrations, the WT peak becomes visible but the mutant peak remains predominant down to 0.1% (percentages have been rounded). At the SNP position (
 ) only G is seen with complete suppression of the WT allele.

