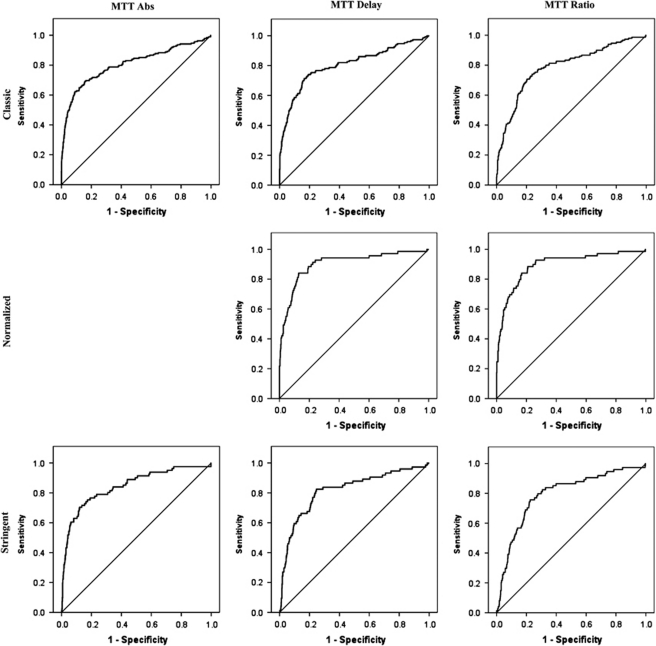
Figure 2.
ROC curves of the three MTT parameters to identify the three penumbra thresholds using all ROIs across all seven patients. The ROC for absolute MTT versus the normalized penumbra threshold was believed to be inappropriate for the purposes of this study; hence, it is missing from this graph. The corresponding AUCs are listed in Table 2.

