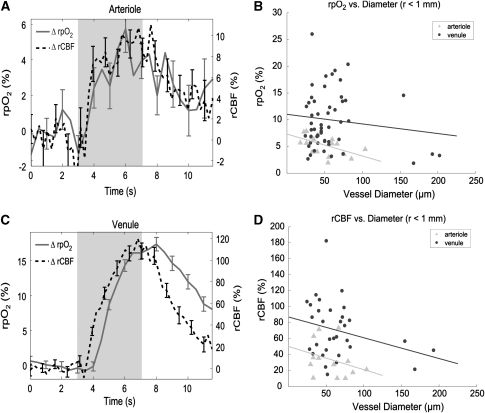
Figure 4.
(A, C) Representative profiles of changes in relative oxygen partial pressure (rpO2) and relative cerebral blood flow (rCBF) in (A) arterioles and (C) venules, in response to somatosensory stimulation. Error bars represent standard error. Shaded region corresponds to period of forepaw stimulation. (B) Peak changes in rpO2 versus diameter, as measured in 10 animals. (D) Peak changes in rCBF versus diameter.

