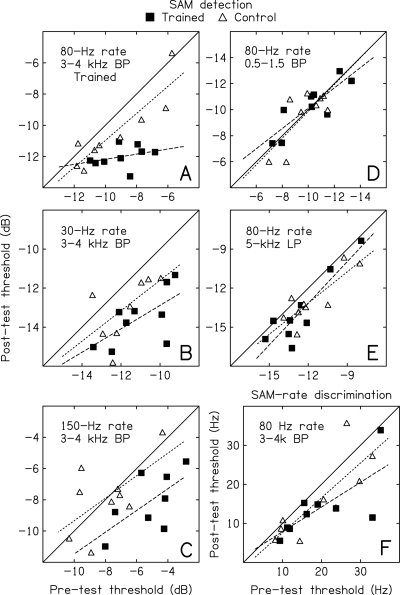
Figure 2.
For each of the six conditions (panels), pre-test (x axis) and post-test (y axis) thresholds are shown for the trained listeners (filled squares) and controls (open triangles). The linear regression of the post-test thresholds on the pre-test thresholds was determined for each data set. Separate lines were estimated for trained listeners (long dashes) and controls (short dashes). The solid diagonal line in each panel indicates a regression-line slope of 1; points below this solid line reflect improvement between the pre- and post-tests.

