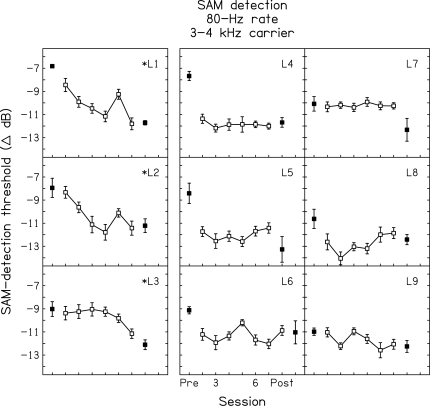
Figure 3.
Thresholds on the trained condition from the pre- and post-tests (filled squares) and during the training phase (open squares) are shown for all nine trained listeners (panels). Error bars indicate ± one standard error of the mean within a given listener. Three listeners improved across the six training sessions (left column; asterisks next to the listener label). The remaining six listeners also improved between the pre- and post-tests, but not across the six training sessions (middle and right columns).

