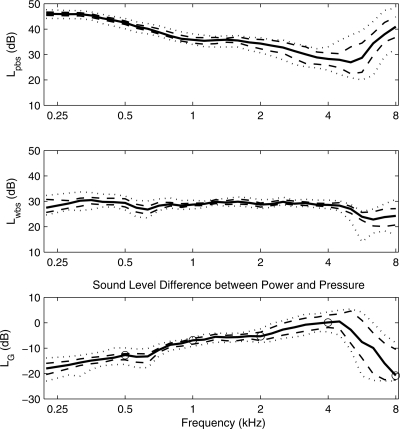
Figure 3.
The band sound pressure spectrum level Lpbs (top panel) and band sound absorbed-power spectrum level Lwbs (middle panel) are plotted as 10th, 25th, 50th, 75th, and 90th percentiles based on 40 adult ears with normal function. The conductance level LG, which is equal to the difference of Lwbs and Lpbs is plotted in the bottom panel as 10th, 25th, 50th, 75th, and 90th percentiles for the same data set. The values on the median LG curve at octave frequencies between 0.5 and 8 kHz are identified with circle markers.

