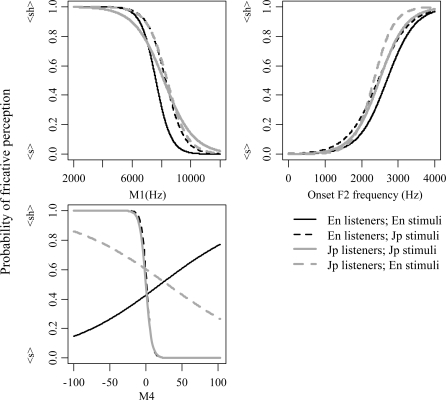
Figure 3.
Probability functions derived from logistic regressions for M1, onset F2 frequency, and M4, respectively. The y-axis shows the predicted probability scores of fricative perception, with “1” being 100% <sh> and “0” being 100% <s>. The x-axis shows the acoustic values of stimuli in each of the three acoustic dimensions. The black lines describe the predicted English-speaking listeners’ responses to English stimuli as a function of acoustic values in M1, onset F2 frequency, or M4; the black dotted lines are English-speaking listeners’ responses to Japanese stimuli; the gray lines are Japanese-speaking listeners’ perceptions of Japanese stimuli; and the gray dotted lines are Japanese-speaking listeners’ perceptions of English stimuli.

