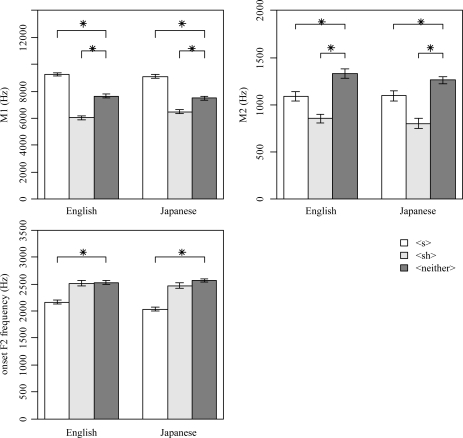
Figure 4.
The mean values of the <s> tokens (the unfilled bars), the <sh> tokens (the light gray bars), and the <neither> tokens (the dark gray bars) for the two listener groups in each of the three acoustic dimensions, respectively. The <s> or the <sh> tokens are defined by receiving more than 70% of yes responses from all the native-speaking listeners when they were asked is this an “s”? or is this an “sh”?, respectively. Error bars indicate one standard error above and below the means. t-Tests were performed between the <s>∕<sh> tokens and the <neither> tokens. Significantly different means at the level of 0.05 are indicated by an asterisk.

