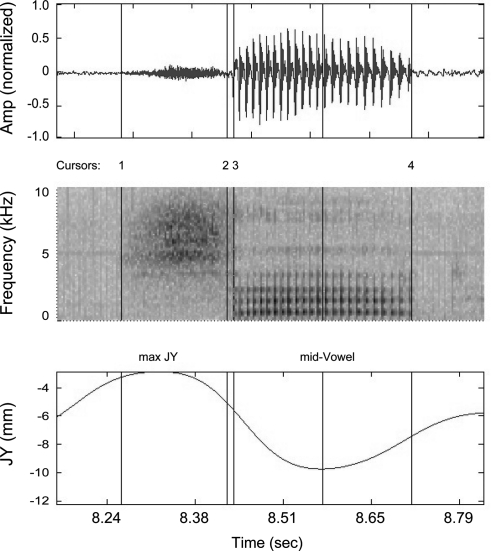
Figure 2.
(Color online) Example illustrating acoustic segmentation of sad as spoken by subject JW11. Top: Speech waveform. Middle: Spectrogram. Bottom: JWy, the y-component of the jaw pellet. Vertical cursor lines in all three graphs indicate (1) frication onset, (2) frication offset, (3) vowel onset, and (4) vowel offset. Max-JY indicates the time at which JWy reaches its maximum height during the [s]; Mid-vowel indicates the midpoint between vowel onset and offset.

