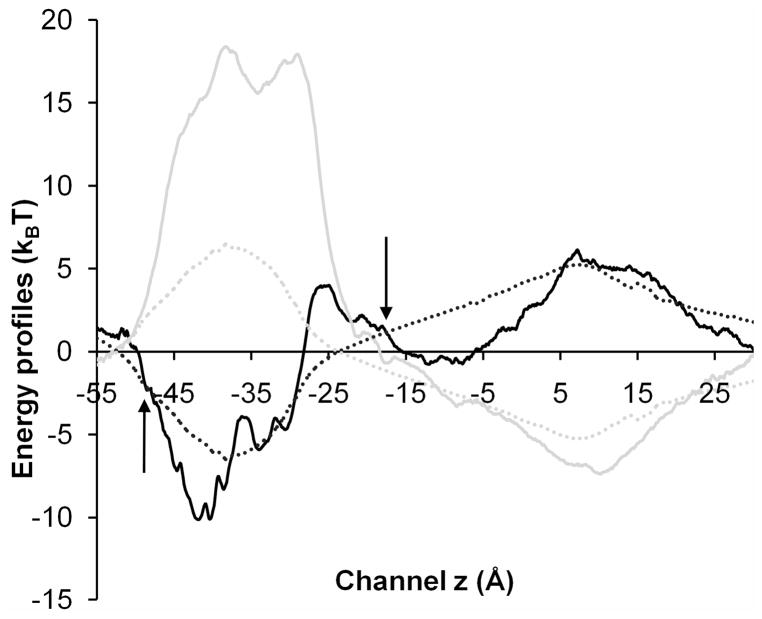
Figure 4.
Comparison of energy profiles for transporting a Na+ (black) or Cl− (gray) ion along the channel centerline of System A. Solid lines represent the single ion PMF calculated by MD and the dotted lines show the electrostatic energy profiles calculated by continuum electrostatics approach. A hybrid MD/continuum strategy was implemented to estimate the PMF for transporting a Na+ or Cl− ion in BD simulations. The z positions (shown via arrows) at which the MD and continuum electrostatics PMFs were joined were chosen to be z= −17.5 Å (near I240) and z= −48.0 Å (near S220), where the lateral variations of 3D electrostatic potential were small (~1 kBT) inside the channel pore.

