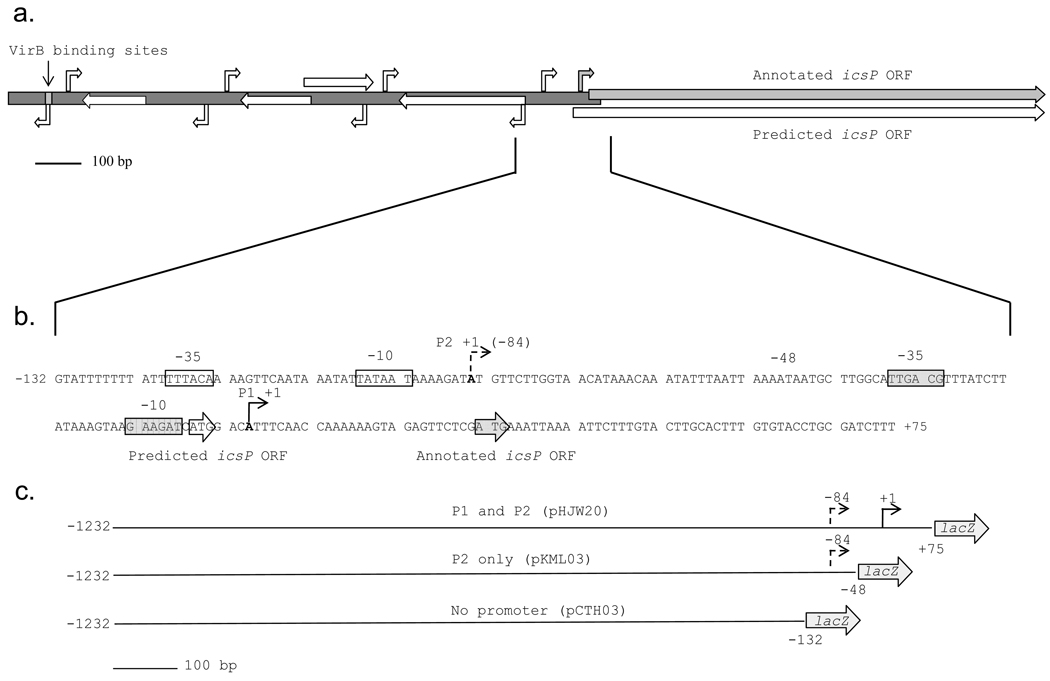
Fig. 1.
Graphical representation of the entire icsP intergenic region and important promoter elements. The entire icsP promoter and gene with the locations of the annotated TSS, ORF, upstream VirB binding sites (grey arrows and box) and predicted TSSs and ORFs (white arrows) (a). Promoter elements of the icsP P1 and P2 promoters (b). P1, solid angled arrow; P2, dashed angled arrow; −10 and −35 sites are boxed and labeled. The P1 and P2 translation start sites are enclosed by arrows and labeled. Schematic representations of the lacZ fusion inserts in pHJW20, pKML03, and pCTH03, respectively (c). The inserts are drawn to scale and the numbers are relative to the P1 TSS.

