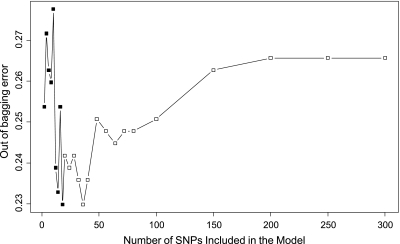
Figure 2.
Prediction error rate of 1330 SNPs using early onset (≤55 years) of EA as outcome. The x-axis denotes the number of SNPs in the model, where the SNPs are included one by one based on their MDA ranks ranging from the most (left) to the least (right) importance. The y-axis is the error rate estimated from 100, 000 trees by random forest analysis. A set of 20 SNPs that had the lowest error rates (0.23) was selected for further logistic regression analysis.

