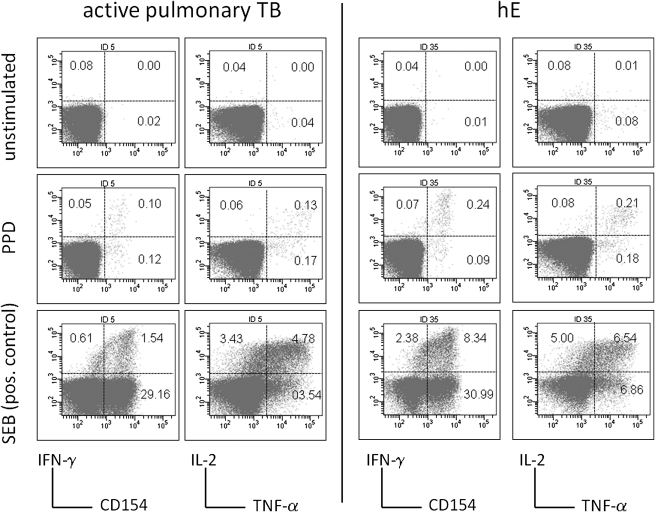
Figure 1.
Detection of tuberculin-specific CD4 T cell responses. Cells were stimulated overnight with tuberculin or SEB. Unstimulated samples were run as controls. Activation was detected by CD154-up-regulation, degranulation (not shown), IFN-γ, TNF-α, and IL-2 production. SEB response size varied strongly between individuals and was not correlated with tuberculin response size. Percentages are indicated in quadrants, axes show log fluorescence intensity, CD4 T cells are displayed.

