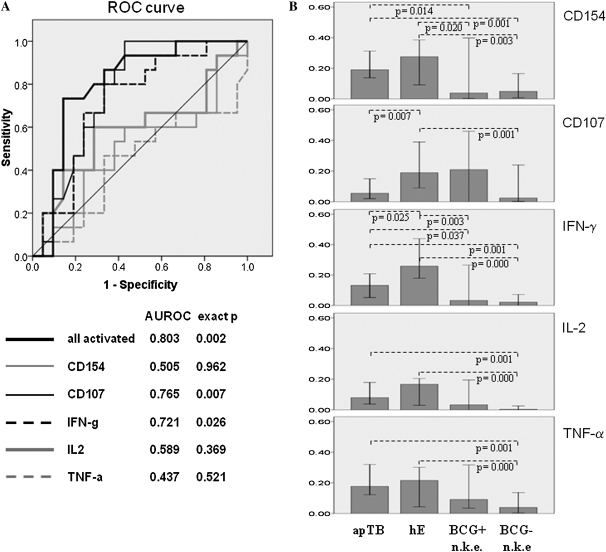
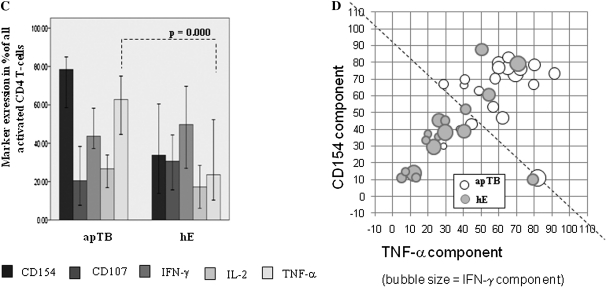
Figure 2.
Frequencies of activated CD4 T cells are higher in apTB than in hE, activation markers differ between groups. A, ROC-curves display sensitivity vs. specificity for discriminating apTB and hE by all tuberculin-induced activation markers combined and each activation marker alone. B, Bars (medians/95% confidence interval [CI]) indicate the frequencies of activated CD4 T cells per each activation marker alone. C, Bars (medians/95% CI) show proportions of activation marker positive cells among all activated cells. CD154 up-regulation was the most dominant single activation marker of tuberculin-specific T cells in apTB. D, Proportions of CD154, TNF-α (axes) and IFN-γ positive cells (bubble size) among all activated CD4 T cells are plotted against each other. The dotted line indicates an apparent division between hE and apTB. (“n.k.e”. = no known exposure to TB). Significant differences in B and C are indicated (Mann-Whitney U test).


