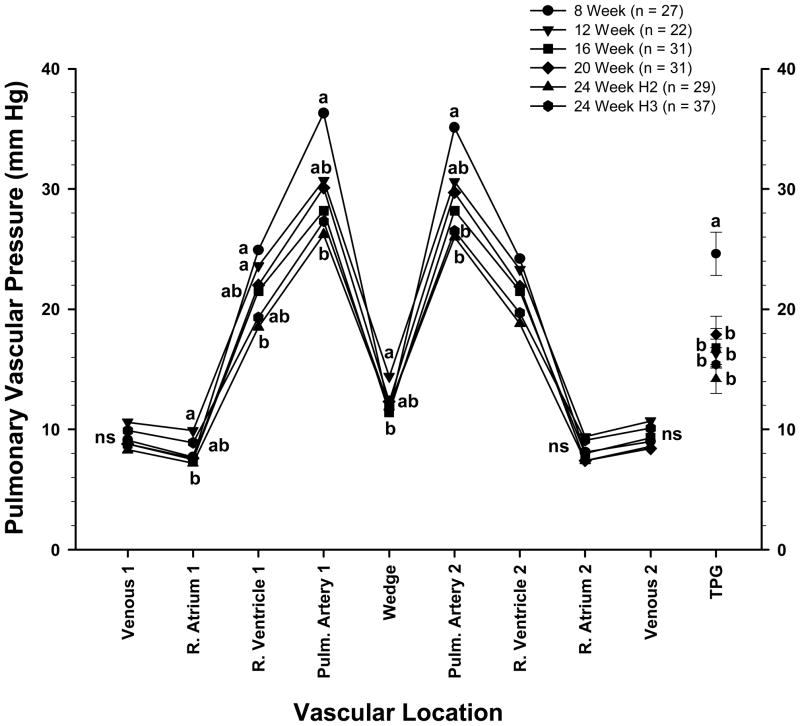
Figure 1.
Symbols represent the mean blood pressures (in millimeters of mercury) of broilers (males and females pooled) from a PHS-susceptible line at 8 through 24 wk of age, including duplicate groups from hatches 2 and 3 at wk 24 (24 Wk H2, 24 WK H3). The pressures were recorded as a catheter was advanced through the wing vein (Venous 1), right atrium (R. Atrium 1), right ventricle (R. Ventricle 1), and pulmonary artery (Pulm. Artery 1) until the wedge pressure was obtained (Wedge). Pressures also were recorded as the catheter was withdrawn from the vasculature (Pulm. Artery 2, R. Ventricle 2, R. Atrium 2, and Venous 2). The transpulmonary gradient (TPG; mean values ± SEM) represents the pulmonary artery pressure minus the WP. a,b Letters represent differences (P ≤ 0.05) between the age groups within a single anatomical location.

