
Figure 9.
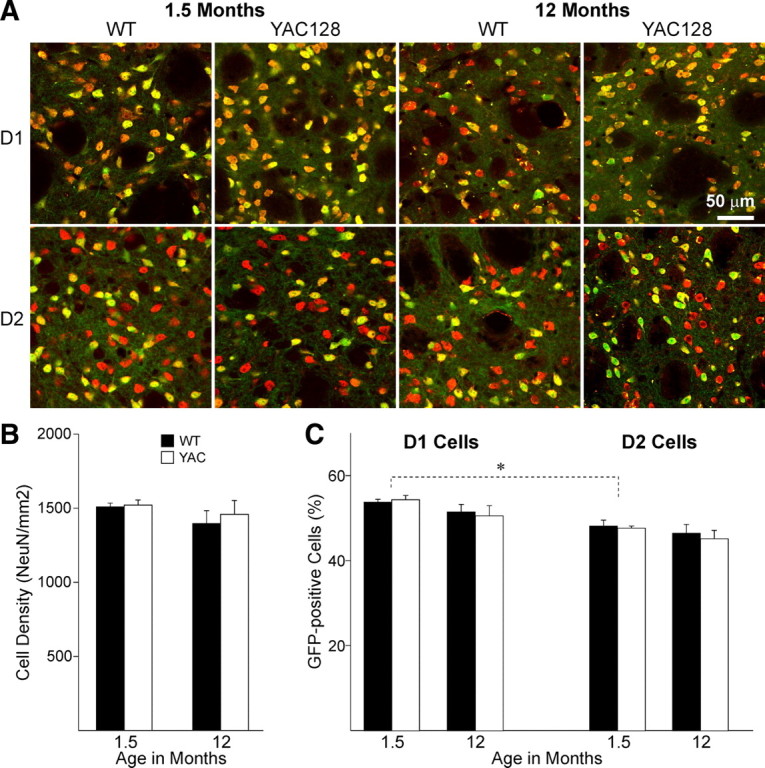
A, Photomicrographs of immunofluorescent staining for NeuN (red) combined with EGFP in D1 (top row) or D2 cells (bottom row), at 1.5 (2 left columns) and 12 (2 right columns) months in the dorsal striatum of WT and YAC128 mice. Pictures show overlay of EGFP and NeuN, in which cells expressing both appear yellow. B, Bar graph of neuronal (NeuN) densities at both ages do not show any differences between WT and YAC128 mice. C, Bar graph shows that the ratio of EGFP-positive neurons does not change between WT and YAC128 mice at any age. There are more D1-EGFP-positive than D2-EGFP-positive neurons at 1.5 months. *p < 0.05 between D1- and D2-EGFP neurons.