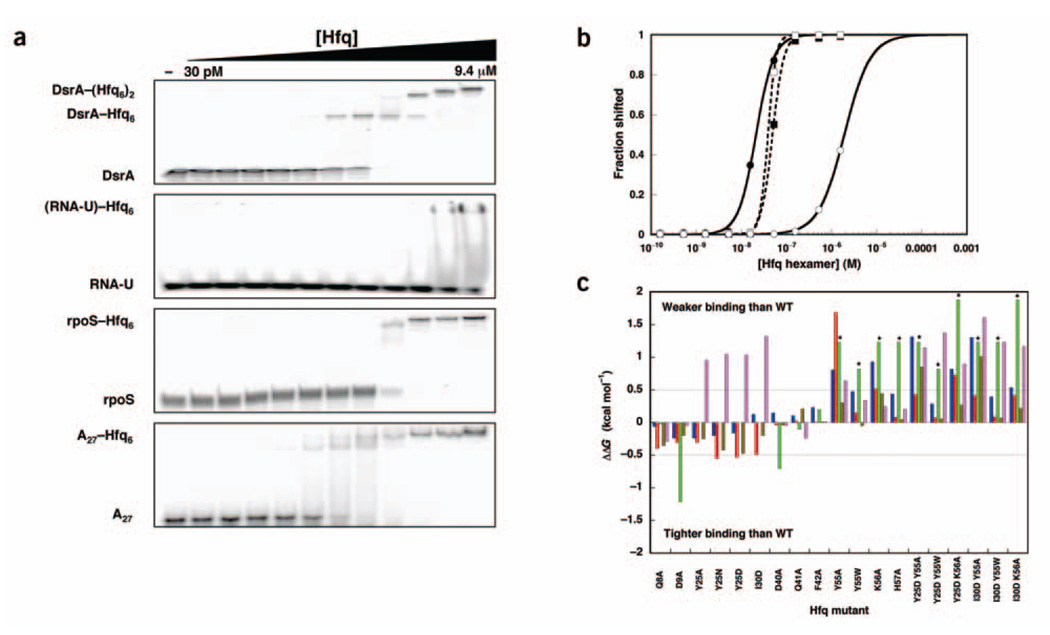
Figure 2.
In vitro analysis of RNA binding to mutant Hfq proteins. (a) Gel shift experiments showing the binding of wild-type Hfq to DsrA, RNA-U, rpoS mRNA 5′ UTR and A27. (b) Quantification of the gel shift experiments in a. (b) Quantification of the gel shift experiments in a. Closed circles, DsrA K1; open circles, RNA-U; closed squares, rpoS mRNA 5′ UTR; open squares, A27. Lines represent nonlinear least-squares fitting to a cooperative binding model. (c) Histogram showing the free energy of binding relative to wild-type (WT) Hfq for each Hfq mutant. ΔΔGs between −0.5 and 0.5 kcal mol−1 indicate insignificant effects on RNA binding. Asterisks indicate data that are lower limits of the actual effect as the interactions were too weak to be measured. Blue, DsrA–Hfq6; red, DsrA–(Hfq6)2; green, RNA-U; brown, rpoS mRNA 5′ UTR; lavender, A27.

