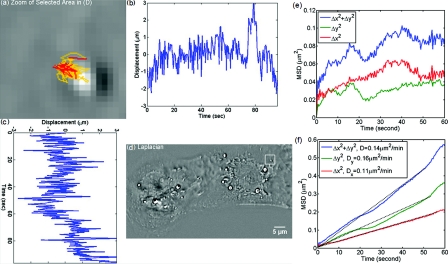
Figure 3.
MSD measurement for particles within the cardiac myocytes in Fig. 2. (a) Zoom into the selected area shown in (d); (b) Displacement in Y direction; (c) Displacement in X direction. (d) Laplacian of the phase map [same as Fig. 2b]; (e) MSD for the particle shown in (a). (f) MSD ensemble-averaged over 15 particles in (d). The respective movie can be found in the supplemental material (Video 2).

