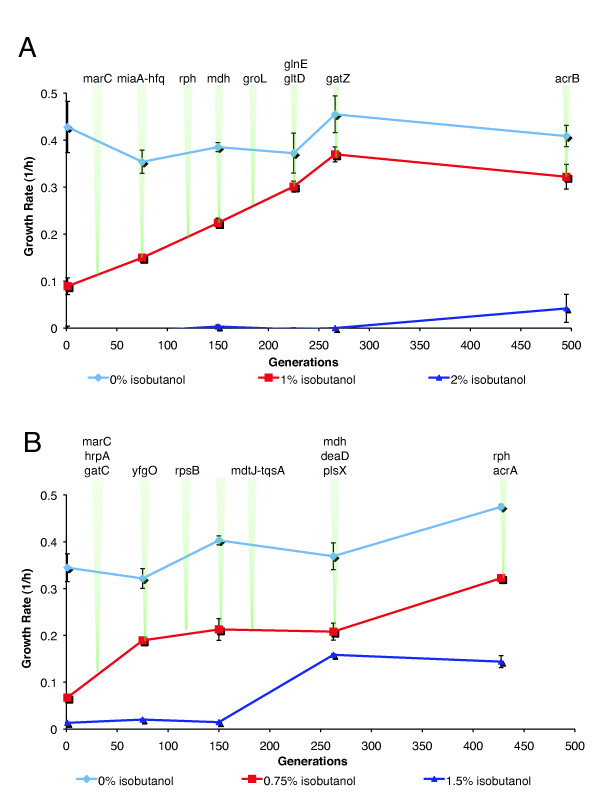
Figure 5.
Fitness trajectories and temporal order of mutations. Intermediate generations of the G3 and X3 lineages were phenotyped and genotyped. Phenotyping was done by measuring growth rate at various isobutanol concentrations, while genotyping was done via allele specific PCR or direct Sanger sequencing of PCR products from whole population samples. Green arrows denote intermediate generations that were genotyped. Mutations are listed above the first generation in which they were detected. (A) Mutations in G3.266.7 and gatZ and acrB mutations (detected in G3.26/G3.6) were traced through various evolutionary time points. (B) All mutations detected in X3.5 were traced through various evolutionary time points.

