
Figure 6.
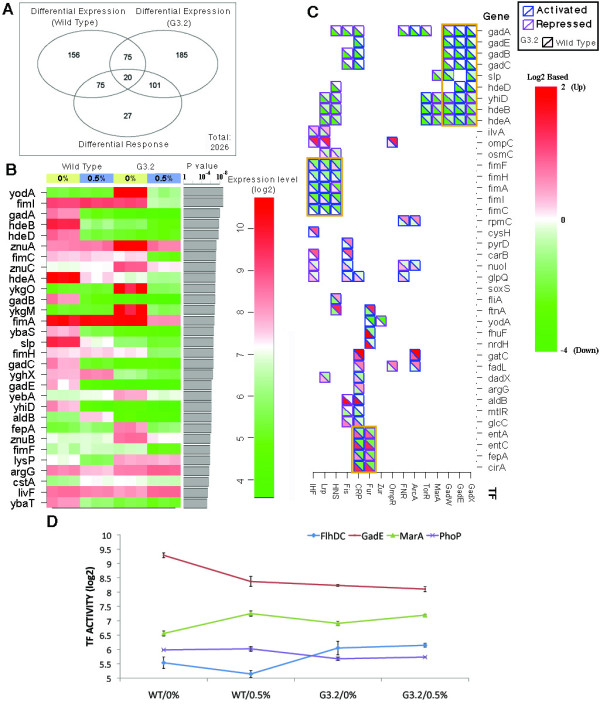
Microarray study of gene expression changes in G3.2. DNA microarray study was conducted to study changes in gene expression between isobutanol tolerant clone G3.2 and the parent E. coli EcNR1. G3.2 and E. coli EcNR1 (WT) were grown to mid-exponential phase in both 0% and 0.5% (w/v) isobutanol spiked minimal media. (A) Summary of genes expression changes. (B) Top 30 genes with the most significant differences in transcriptional response between G3.2 and WT. (C) Top 40 genes with the most significant differences in transcriptional response between G3.2 and WT, and controlling transcription factors. (D) Activities of transcription factors predicted by Network Component Analysis (NCA).