
Figure 3.
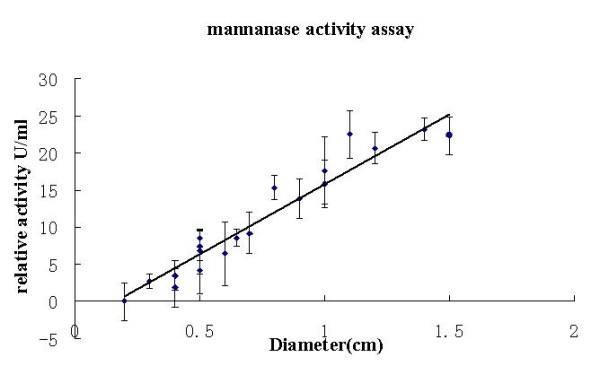
Relative activity assay of the fermentation broth supernatant. All measurements were carried out as triplicates, and means ± SD are shown. The trend line shows a linear; Curve fitting was performed by Microsoft Excel 2003.
Official websites use .gov
A
.gov website belongs to an official
government organization in the United States.
Secure .gov websites use HTTPS
A lock (
) or https:// means you've safely
connected to the .gov website. Share sensitive
information only on official, secure websites.
Relative activity assay of the fermentation broth supernatant. All measurements were carried out as triplicates, and means ± SD are shown. The trend line shows a linear; Curve fitting was performed by Microsoft Excel 2003.