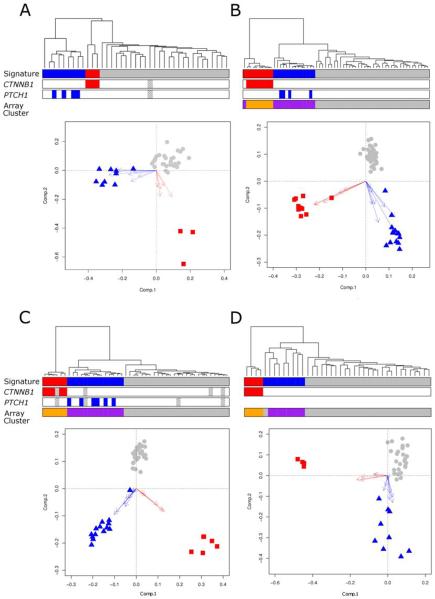
Figure 1. Diagnostic WNT and SHH subgroup gene expression signatures recognize equivalent molecular subgroups across multiple medulloblastoma cohorts.
Data from four independent datasets are shown (A, primary investigation cohort; B, Kool et al (n=62; (12)); C, Thompson et al (n=46, (13)); D, Fattet et al (n=40, (15)). WNT and SHH subgroup expression signature positivity demonstrates close concordance with (i) underlying molecular defects in the respective pathways and (ii) discrete sample clusters identified on independent clustering of the most variable probes in each array dataset (Supplementary Figure 2). Each panel (A-D) shows hierarchical clustering of signature genes (WNT subgroup, red; SHH subgroup, blue; WNT/SHH-independent, grey). Mutational information for CTNNB1 and PTCH1 is shown (coloured boxes, mutation; grey checked boxes, missing data). Array clusters which show concordance with the detected SHH and WNT subgroup signatures (derived by clustering the most variable probes of each whole array dataset) are shown (purple, SHH subgroup; orange, WNT subgroup (Supplementary Figure 2)). Biplots show PCA for each signature geneset. Arrows show projections of expression axes for each gene (SHH signature genes, blue; WNT signature genes, red; WNT/SHH-independent cases, grey).

