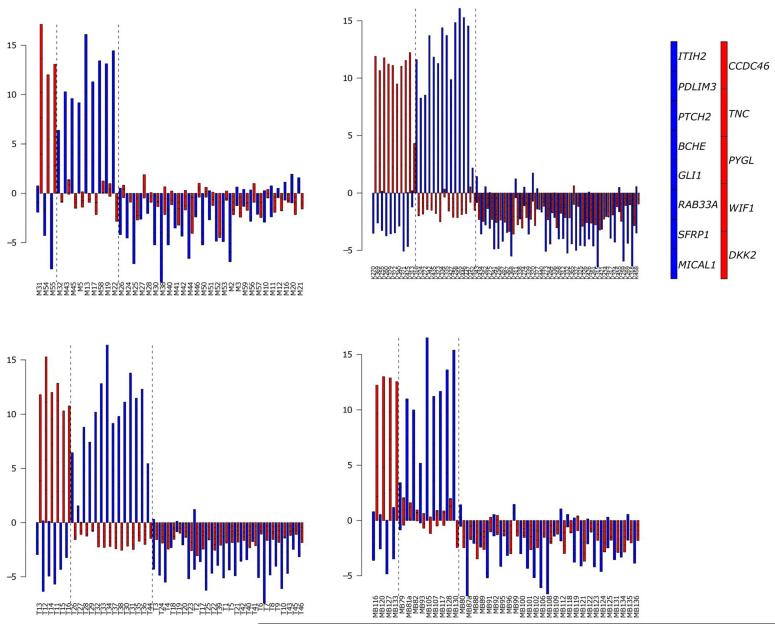
Figure 2. Identification of SHH and WNT subgroup medulloblastomas using diagnostic expression signatures.
Data are illustrated from the four independent datasets using stacked barplots (A, primary investigation cohort; B, Kool et al (n=62; (12)); C, Thompson et al (n=46, (13)); D, Fattet et al (n=40, (15)). WNT signature genes (red) and SHH signature genes (blue) in combination clearly define subgroup membership. Vertical dashed lines delineate sample groups positive for WNT and SHH signatures by hierarchical clustering and PCA analysis in Figure 1. Right-hand panel indicates stacked order of genes for each signature. Prior to generation of barplots, expression data from each cohort was scaled on a per gene basis to a mean of zero and a variance of one. Samples expressing all or most signature genes at above average levels will show bars of greater positive magnitude.

