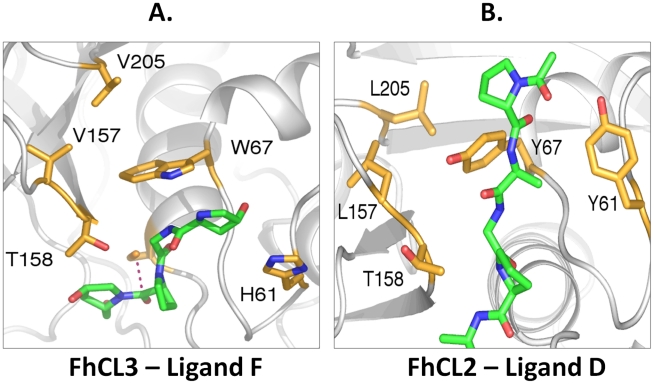
Figure 6. Binding mode of Gly at P2 in the FhCL2 and FhCL3 S2 subsites.
The side-chains of residues mutated in the MD simulations are shown in stick form with carbon atoms tan, oxygen red and nitrogen blue, with papain numbering. The ligand is shown in stick form with carbon atoms green, oxygen red and nitrogen blue. Secondary structural elements of the peptidase are in shown in cartoon representation in grey. (A) Frame from the final 4 ns of the FhCL3-ligand F (PPGP*PGP) simulation showing the interaction of the Trp (W) 67 side-chain within the S2 subsite cleft with the ligand P2 Gly (G). The N-terminal acyl group and Pro residue of ligand F are omitted for clarity. The S-C distance is indicated by a red dashed line. (B) Final frame from the FhCL2-ligand D (PAGP*AGP) simulation showing the interaction of the Tyr (Y) 67 side-chain within the S2 subsite cleft with the ligand P2 Gly (G).

