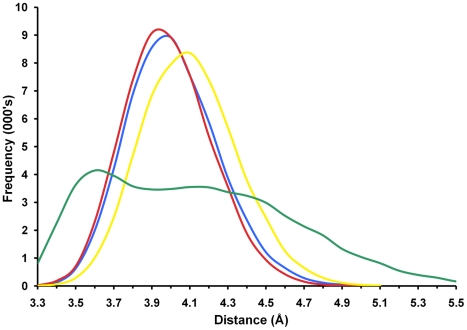
Figure 7. Frequency distributions of nucleophilic sulphur-scissile carbon distances.
Smoothed histogram plots of the frequencies of distances between the sulphur atom of the active site nucleophilic sulphur atom and the ligand P1 backbone carbonyl carbon atom. Measures taken over the final 4 ns of each simulation at 0.075 ps intervals (53334 measures per simulation); frequencies assigned to 0.1 Å bins between 3.3 Å and 5.5 Å. Simulation FhCL1-ligand A blue, FhCL2-ligand C red, FhCL3-ligand C yellow, FhCL3-ligand F green.

