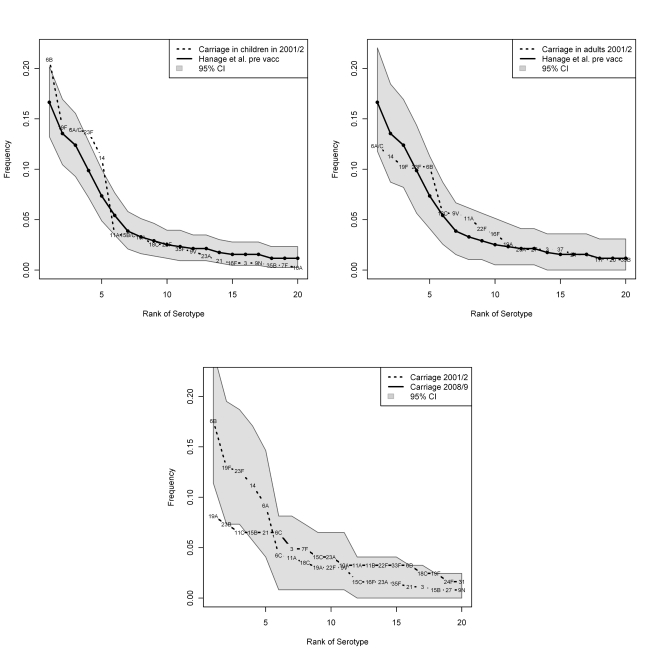
Figure 1. Top: Comparison in ranked-serotype distribution prior to vaccination in children in Massachusetts to our findings in children (left) and adults (right).
For comparison with the findings with Hanage and colleagues, we aggregate 6A and 6C to 6A/C and 15B and 15C to 15B/C. Bottom: Changes in ranked serotype distribution in overall carriage in our findings from 2001/2002 to 2008/2009.

