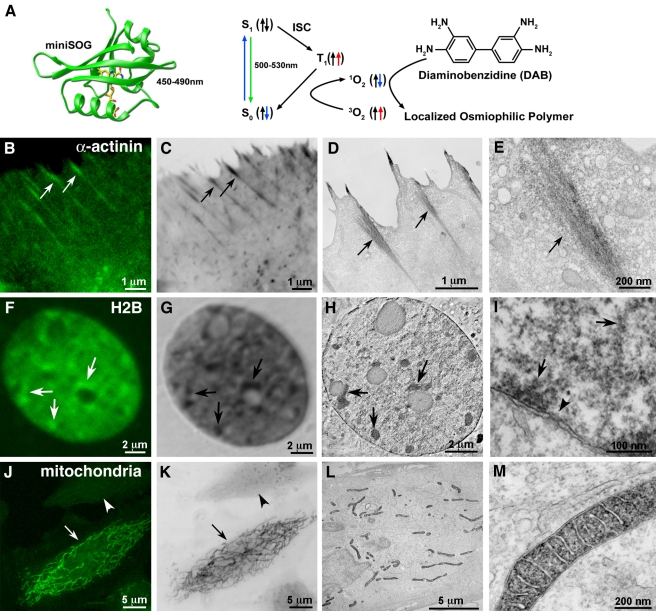
Figure 3. MiniSOG produces correlated fluorescence and EM contrast with correct localization of labeled proteins and organelles.
(A) Schematic diagram of how miniSOG produces EM contrast upon blue-light illumination. Spin states are depicted by the arrows. ISC, intersystem crossing. Correlated confocal fluorescence (B,F,J), transmitted light (C,G,K), and electron microscopic (D,E,H,I,L,M) imaging of a variety of proteins. (B–E) HeLa cells expressing miniSOG labeled α-actinin. Arrows denote correlated structures. (F–I) Histone 2B. Panel H is a 3 nm thick computed slice from an electron tomogram. Panel I is a high magnification thin section electron micrograph showing labeled chromatin fibers near the nuclear envelope (arrows) and a nuclear pore (arrowhead). (J–M) Mitochondrial targeted miniSOG. Panels J and K show a confocal image prior to photooxidation and a transmitted light image following photooxidation, respectively. The differential contrast generated between a transfected (arrows) and non-transfected cell (arrowheads) is evident. Bars B–D, 1 micron; E, 200 nm; F–H, 2 microns; I, 100 nm; J–L, 5 microns; M, 200 nm.

