
Figure 1.
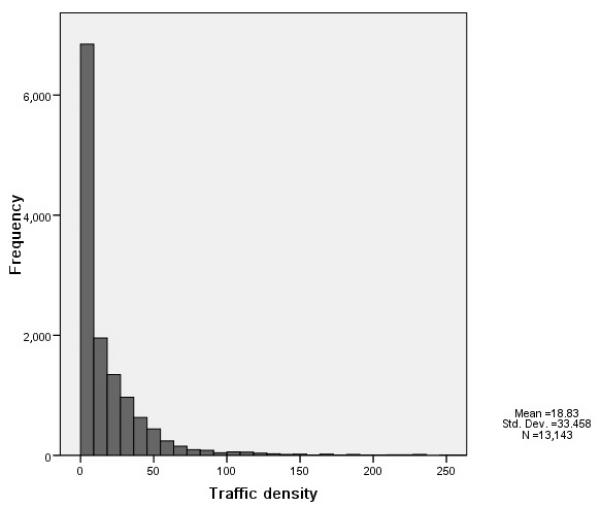
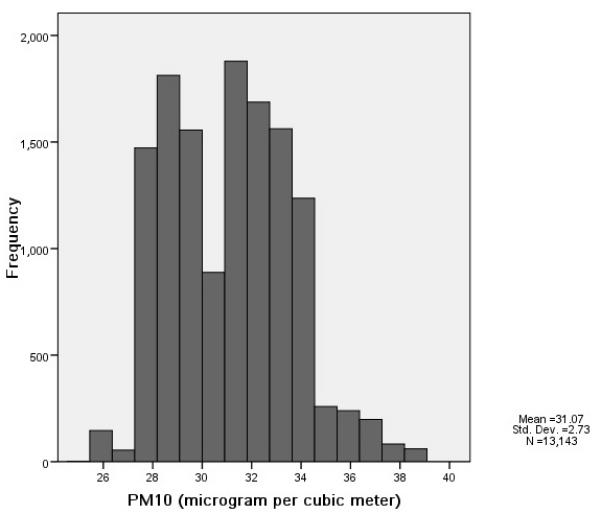
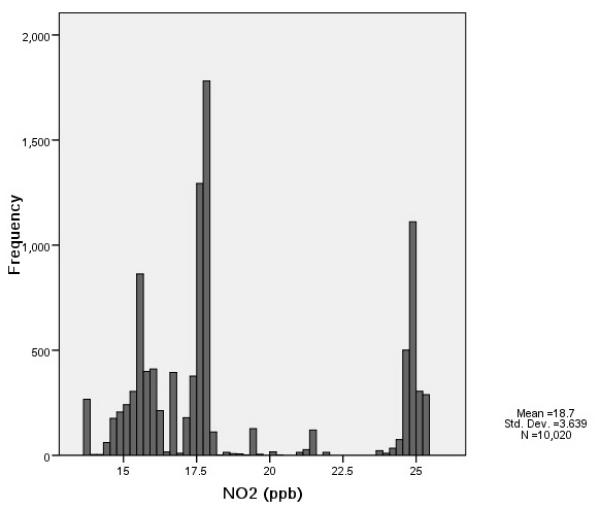
Distribution of traffic density and background air pollutant concentrations at ARIC participant residences (1987–1989). (A) Traffic density (n=13,143). (B) PM10 (μg/m3; n =13,143). (C) NO2 (ppb; n=10,020).
Official websites use .gov
A
.gov website belongs to an official
government organization in the United States.
Secure .gov websites use HTTPS
A lock (
) or https:// means you've safely
connected to the .gov website. Share sensitive
information only on official, secure websites.
Distribution of traffic density and background air pollutant concentrations at ARIC participant residences (1987–1989). (A) Traffic density (n=13,143). (B) PM10 (μg/m3; n =13,143). (C) NO2 (ppb; n=10,020).