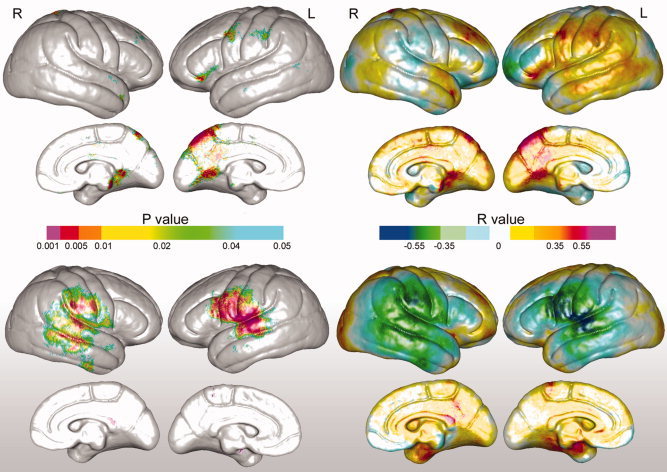
Figure 4.

Statistical maps showing associations between arcuate fasciculus axial diffusivity (top panel) and radial diffusivity (shaded bottom panel) and cortical thickness encoded in color. Uncorrected probability values and partial correlation coefficients (age and gender controlled) are shown on the left and right panels, respectively.
