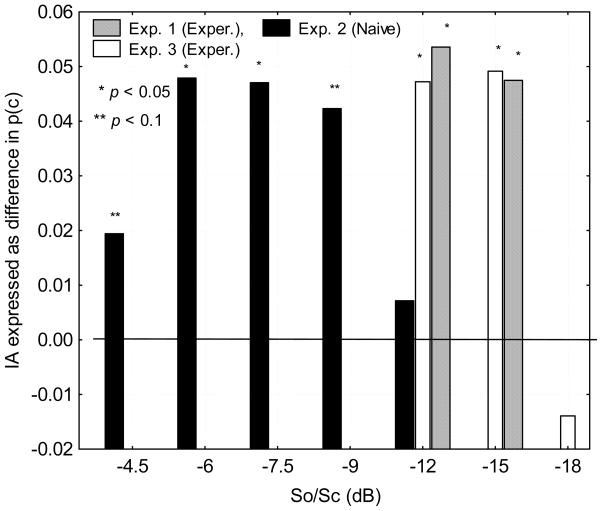
Figure 5.
IA across all three experiments as a function of So/Sc. The IA was calculated from the difference in mean p(c) between the congruent and incongruent conditions. An asterisk or double asterisk denotes a probability of being different from zero of p < 0.05 and p < 0.10, respectively. Experiments 1 & 3, using experienced listeners, showed an IA at much lower So/Sc than Experiment 2, which included naïve listeners.

