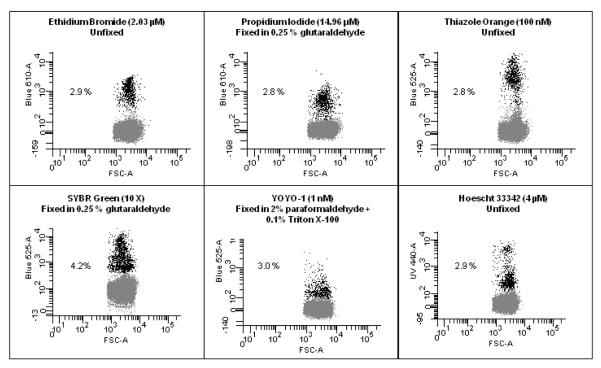
Figure 3. Comparisons of Different DNA stains.
A sample of P.falciparum (3D7 Strain, MRA-102 deposited to ATCC/MR4 by DJ Carucci) was cultured as previously indicated (McNamara et al., 2006) to a parasitemia of 2.9% as determined by Giemsa stained microscopy slide. This culture was then exposed to stains commonly used to examine malaria. Though there may be more optimal methods, staining was carried out as indicated in references; Ethidium Bromide (Persson et al., 2006), Propidium Iodide (Pattanapanyasat et al., 1997), Thiazole Orange (Makler et al., 1987), SYBR Green (Dent et al., 2008), YOYO-1 (Dahl and Rosenthal, 2007), Hoechst 33342 (Grimberg et al., 2008) and the resulting frequency of positive cells is indicated. The blood sample used for this study were leukocyte depleted using Histopaque 1119 and had been in culture for 3 days and therefore, there were few reticulocytes left at the time of analysis. In addition, the parasites had been serial transferred two times after thawing from frozen stocks which led to very clean samples, (i.e. containing very few dead parasites or cell fragments), which led to 5 out of the 6 stains tested showing the same parasitemia. When dealing with samples from patients all of the above issues can confuse a clear delineation between uninfected and infected cells. This figure shows that when using a well prepared in vitro sample with a moderate parasite load, many of the commonly used stains can determine parasitemia.

