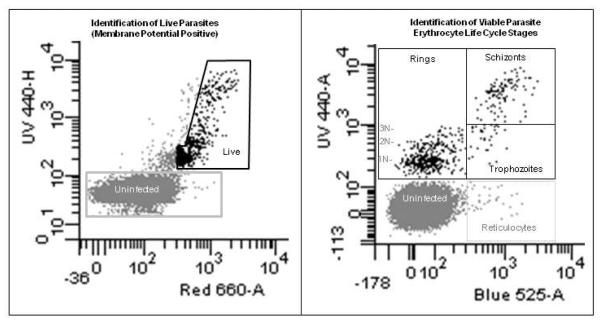
Figure 4. Identification of Erythrocyte Lifecycle Stages of P. falciparum.
The same sample of 2.9% parasitemia culture of P. falciparum used in Figure 3 was stained with HO342, TO, and DiIC1-5 as described in Grimberg et al. (2009). Gates positions were determined previously (Grimberg et al., 2008; Grimberg et al., 2009). In brief, DNA positive cells (Y-axis, UV 440, HO342) in the left hand panel which showed membrane potential (X axis, Red 660, DiIC1-5) greater than that of the red blood cells were considered to be alive. The slanted area of this gate was determined by the application of a cyanide derivative (carbonyl cyanide 3-chlorophenylhydrazone) which disrupts membrane potential within the cells. In the right hand panel, the DNA negative uninfected cells (from the gray square) are shown along with the Live DNA positive cells (black polygon). By showing the relative amount of RNA in these cells one can clearly identify the different erythrocyte life cycle stages of the parasites. Ring stages do not express very much RNA, trophozoites express RNA but do not replicate DNA, and schizonts have increases in both RNA and DNA. The delineation between schizonts and trophozoites has been made between 3 and 4 copies of DNA (Grimberg et al., 2008) in general because of the lack of 4N rings (therefore 4N DNA/RNA positive cells almost exclusively arise through DNA synthesis).

