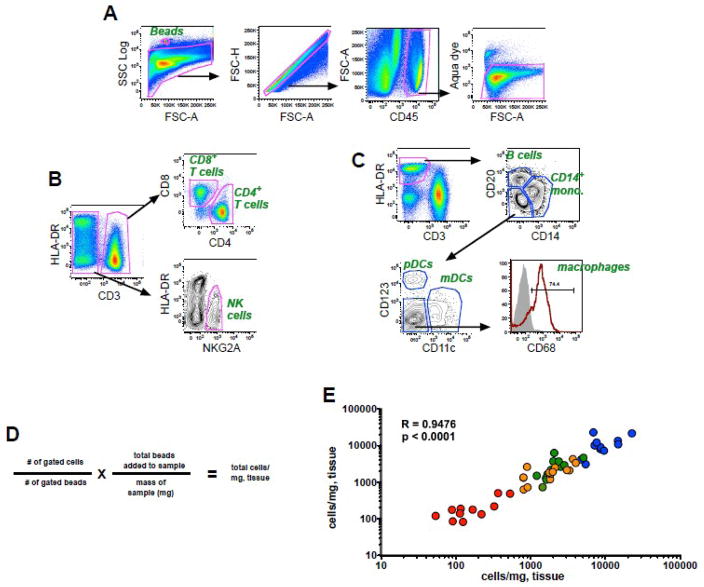
Figure 1. Bead-based cellular quantification in rectal biopsies.
Representative gating strategies showing fluorescence profiles of (a) beads and live cells and subsequent gating for (b) T cells and NK cells or (c) monocytes, B cells, and dendritic cells. (d) Formula for calculation of cell numbers/milligram of tissue. (e) Correlation of absolute cell counts obtained from duplicate colorectal biopsies from 12 animals. Color coding: blue, CD45+ leukocytes; orange, CD8+ T cells; green, CD4+ T cells; red, NK cells. The correlation between the replicate tests was determined using the Spearman rank correlation coefficient.

