Figure 2.
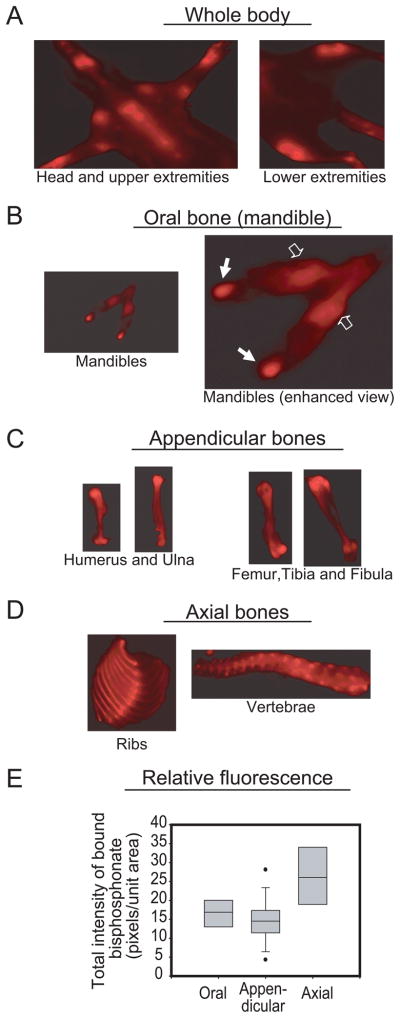
In vivo optical imaging of hydroxyapatite-bound bisphosphonate. Representative ventral view of the whole body of a rat (A) showing signal intensity of regional skeletal uptake of fluorescently labeled bisphosphonate. Following dissection, representative in vitro images demonstrated variable bisphosphonate skeletal uptake. The mandible [oral bone] was displayed strong intensity in the body (B, clear arrows) and condyles (B, solid arrows). Similarly, signal intensity was stronger in the proximal and distal ends relative to the diaphysis of the long bones [appendicular bones] (C). Signal intensity was heterogeneous in the ribs and vertebra [axial bones] (D). Analysis of regional signal intensity in the animals showed variable skeletal uptake as presented in the box and whisker plots (E) [n = 4; median is the line within the box; the ends of the boxes define 25th and 75th percentiles; the two bars outside the box define 10th and 90th percentiles].

