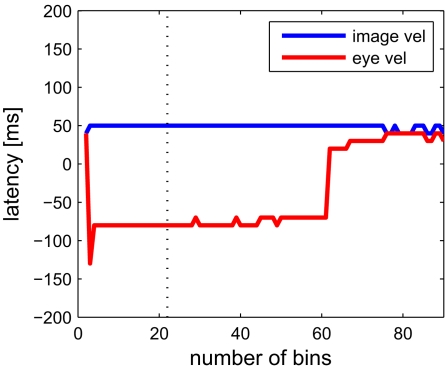
Figure 5.
Dependence of the estimated latency on the choice of number of bins, which were used to discretize each dimension. Estimated latencies of image velocity (blue) and eye velocity (red) are plotted. The dotted line indicates the optimal number of 22 bins. Especially for eye velocity, the latency estimate becomes unstable with a very low number or when exceeding more than 60 bins. For more than 90 bins per dimension there are less than 100 samples per bin on average, resulting in errors due to the sampling bias (see Section 2).

