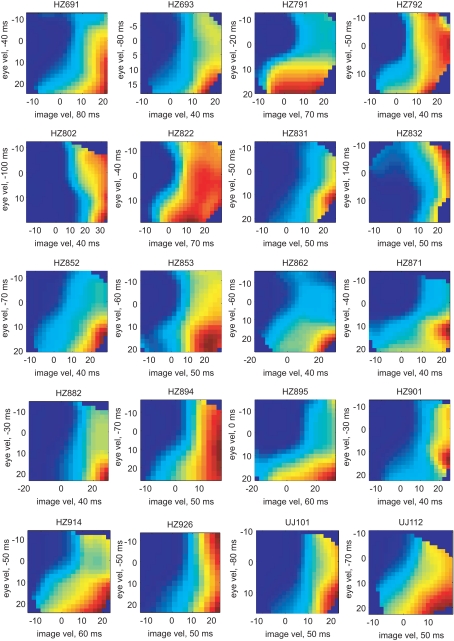
Figure 8.
Tuning functions for [image velocity & eye velocity] of those 20 neurons where this pair of variables showed maximal mutual information. The labeling is analog to Figure 6. The expected rate of spiking activity increased in general with higher image and eye velocity values. However, the shape of the tuning functions differed remarkably in each neuron.

