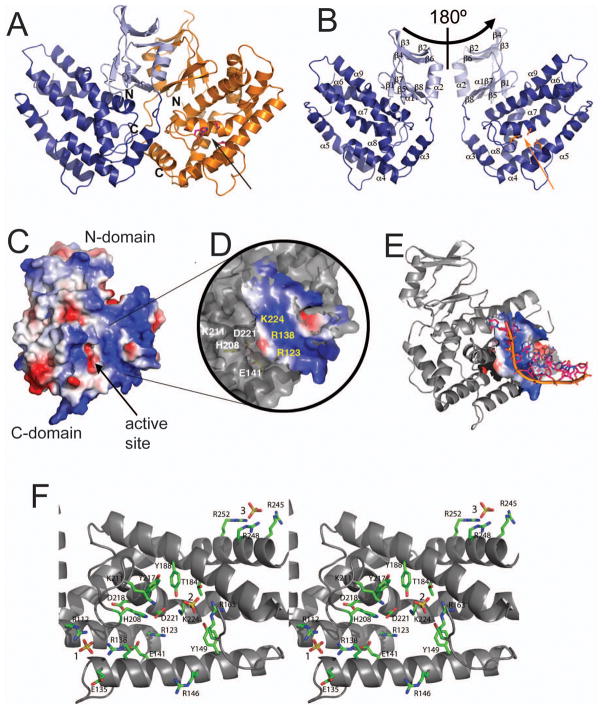
Fig. 3.
Crystal structure of YgbT and the potential active site. (A) Overall structure of the YgbT dimer. (B) Two views of the YgbT monomer (related by a 180° rotation) showing the presence of two domains: the N-terminal β-sandwich-like domain (light-blue) and the C-terminal all-α domain (dark-blue). The position of the potential active site is indicated by the side chains of three conserved residues (shown as sticks). (C) Surface charge presentation of the YgbT monomer showing the presence of several large basic patches representing potential DNA-binding sites (colored in blue). (D) Close-up view of the main basic patch of YgbT located close to the potential active site (E141, H208, and D221) and showing the position of several conserved residues. (E) Superposition of the ssDNA fragment from the E. coli topoisomerase III DNA-binding site (1i7d) onto the potential DNA-binding site of YgbT. The DNA docking was performed using the Surface Screen analysis (Binkowski and Joachimiak, 2008). (F) Close-up stereo view of the YgbT active site from the structure of the C-terminal domain showing the position of three bound sulfate molecules shown as sticks and labelled (1, 2, and 3). The YgbT residues are shown as green sticks along a YgbT ribbon (grey). Two arrows in A and B indicate the protein side and position of the active site shown in C.

