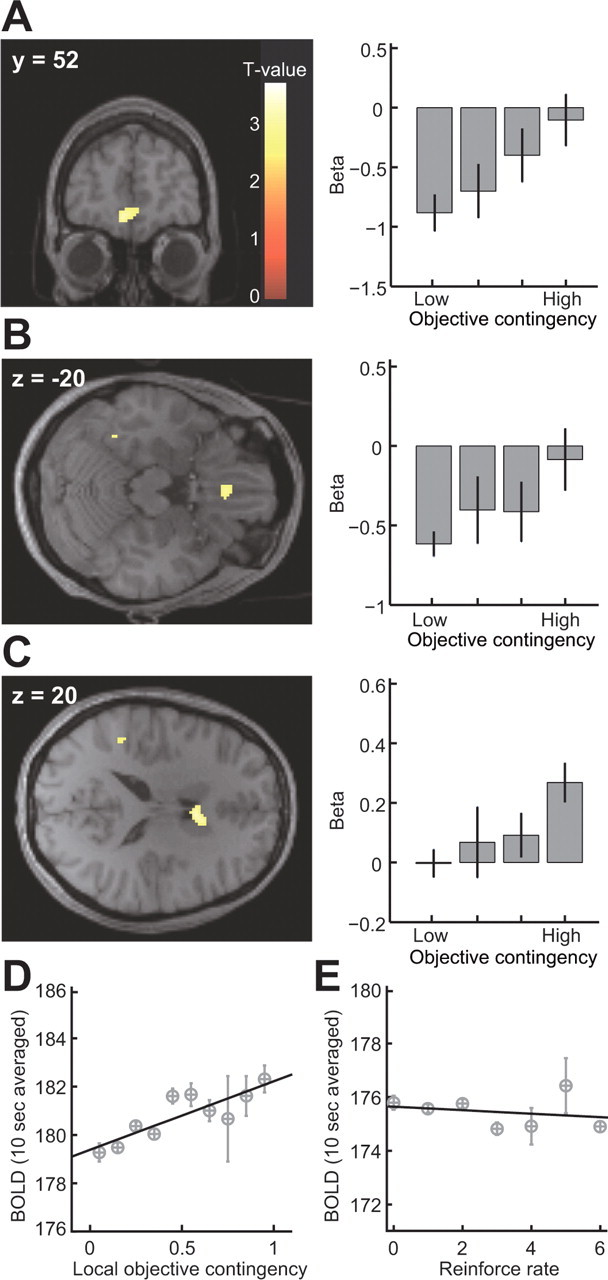
Figure 3.

A–C, Voxels showing significant correlations with the global objective correlation in the mPFC [(x, y, z) = (−6, 52, −10); p < 0.05, SVC with a 5 mm sphere centered at (6, 57, −6) (Hampton et al., 2006); A], mOFC [(x, y, z) = (−2, 30, −20); p < 0.05, SVC with a 5 mm sphere centered at (−3, 36, −24) (Valentin et al., 2007); B], and dorsomedial striatum [anterior caudate nucleus; (x, y, z) = (6, 10, 20); p < 0.001, uncorrected; C]. Bar plots show parameter estimated at each peak voxel sorted by global objective correlation. D, Plot of averaged BOLD signal extracted from mPFC, against the local objective correlation and regression slope (R2 = 0.72; p = 0.0021). E, Plot of averaged BOLD signal extracted from mPFC against reinforcement rate and regression slope (R2 = 0.053; p = 0.62). Error bars = 1 SEM.
