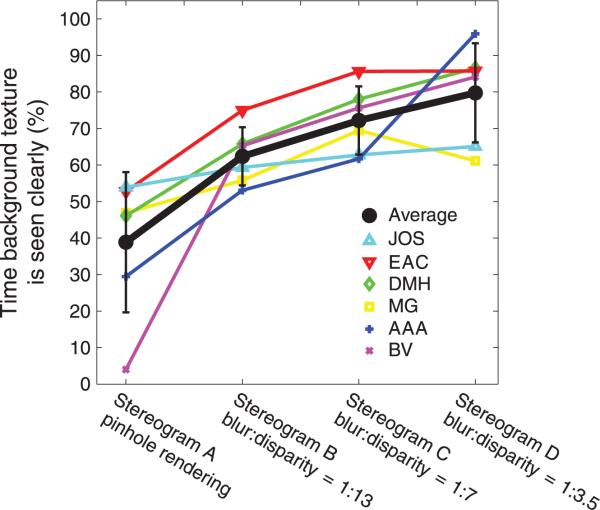
Figure 13.
Results for Experiment 2. The percentage of time the background texture was perceived as dominant is plotted on the ordinate. The different stimulus types are plotted on the abscissa. The colored symbols represent the data from each observer. The black symbols represent the across-observer averages. Error bars are standard deviations.

