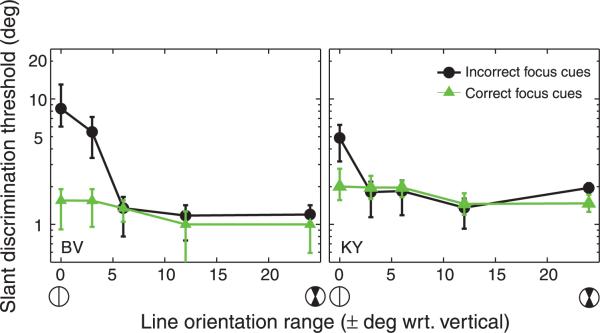
Figure 8.
Results from Experiment 1A. The abscissa represents the half range of line orientations in the stimulus (uniform distribution). The icons beneath the abscissa depict the orientation range. The ordinate is the slant discrimination threshold. The black circles represent the data when focus cues were incorrect (front and back planes presented on one image plane) and the green triangles represent the data when focus cues were correct (front and back planes presented on different image planes). Error bars represent 95% confidence intervals.

