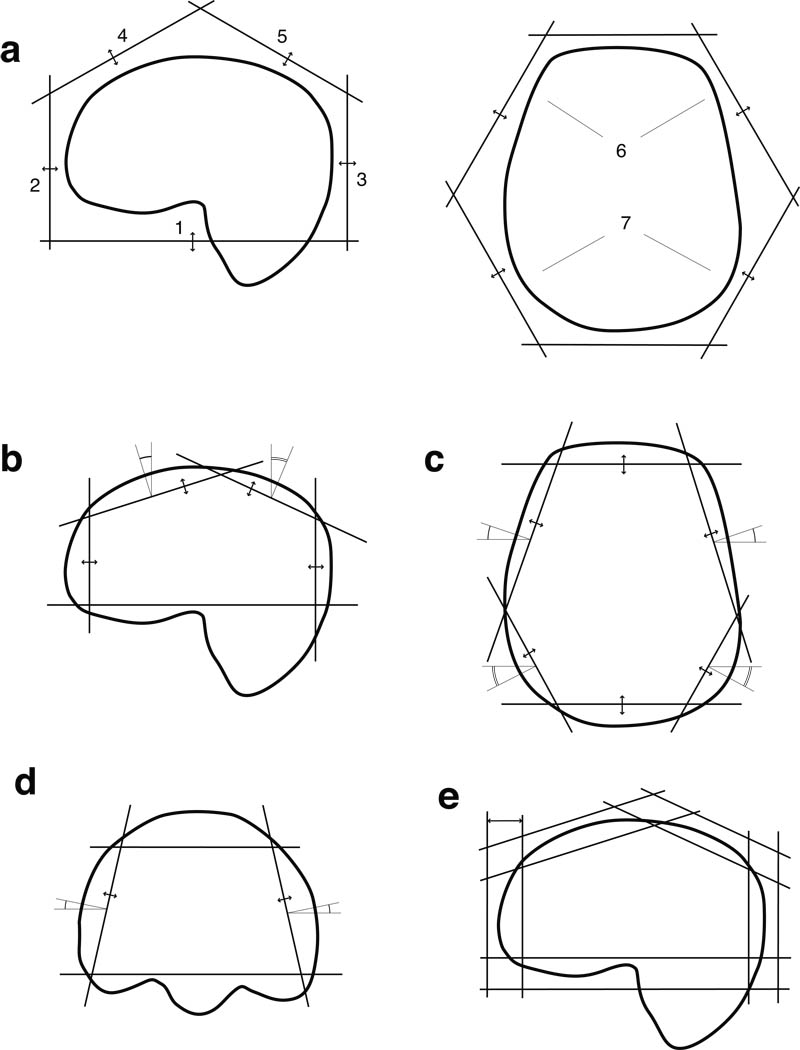
Fig. 2.
The sequence of optimizations to obtain the sat band prescription consisted of: (a) the distances to individual sat bands were optimized in the order, indicated by the numbers; (b) optimization in the sagittal plane; (c) optimization in the axial plane; (d) tilt angle and distance optimization for side bands (first anterior ones, then - posterior ones); second sagittal optimization (not shown); (e) optimization of thickness of individual bands

