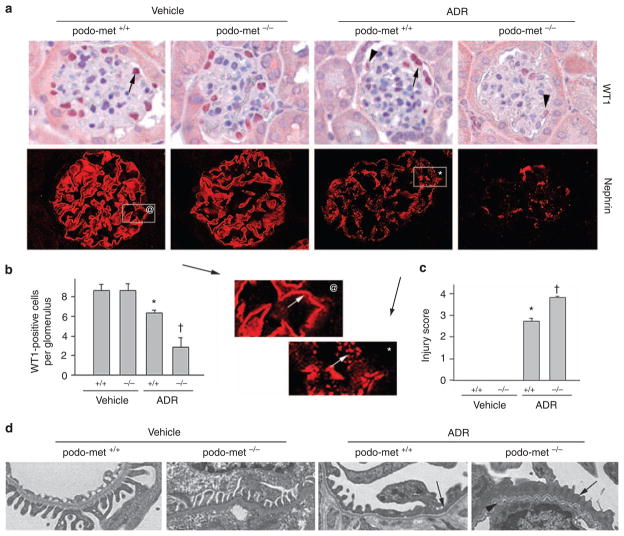
Figure 3. Ablation of c-met receptor aggravates podocyte injury induced by adriamycin (ADR).
(a) Immunohistochemical staining for Wilm’s tumor 1 (WT1) and nephrin in different groups as indicated. Arrows indicate WT1-positive cells in the glomeruli. Arrowheads denote weak staining for WT1 in the glomeruli after ADR injection (25 mg/kg body weight). Boxed areas were enlarged to show the distribution pattern of nephrin in control and ADR-treated glomeruli. A fine, linear nephrin staining pattern was observed in normal glomeruli (@), whereas a disorganized, granular staining was observed after ADR injection (*). (b) Quantitative determination of WT1-positive cells in the glomeruli in different groups as indicated. Data are expressed as WT1-positive cells per glomerular cross-section. (c) Semi-quantitative determination of podocyte injury score (as defined by nephrin loss and altered distribution) in different groups. *P<0.05 versus vehicle treatment (n = 4–11). †P<0.05 versus control podo-met +/+ mice after ADR (n = 11). (d) Electron microscopy (EM) shows the ultrastructure of glomerular filtration apparatus in different groups. Representative EM pictures demonstrate podocyte foot process effacement (arrows) and altered glomerular basement membrane (arrowhead) after ADR injection.

