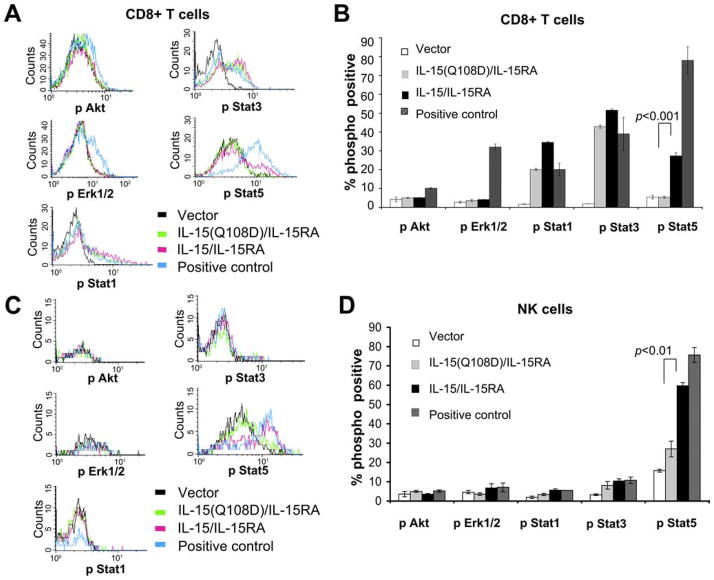
FIGURE 7.
Characterization of the phosphorylation of signaling effectors in the IL-2/IL-15 receptor signal pathway. CD8+ cells or NK cells were isolated from naive C57BL/6 mice or OT-1 RAG−/− C57BL/6 mice. NK or CD8 cells were cocultured with TC-1 cells transduced with IL-15/IL-15RA, IL-15(Q108D)/IL-15RA, or empty vector at a ratio of 1:1 for 45 min. For AKT and ERK1/2 analysis, CD8+ OT-1 RAG−/− cells were similarly treated after 4 h of serum starvation. As positive controls, C57BL/6 CD8+ cells were cocultured with IL-15(Q108D)/IL-15RA-transduced TC-1 cells + 50 ng/ml IL-15, and OT-1 RAG−/− CD8+ cells were treated with OVA peptide (ERK1/2) or OVA peptide + anti-CD28 + serum (AKT). Cells were stained and analyzed for the phosphorylated forms of intracellular AKT, ERK1/2, STAT1, STAT3, or STAT5 using flow cytometry analysis. A and C, Staining intensity of indicated phosphorylated proteins in purified CD8+ T cells (A) and NK cells (C) after coincubation with the indicated transduced TC-1 cells. B and D, Percentage of CD8+ T cells (B) and NK cells (D) expressing the phosphorylated form of the indicated proteins after coincubation with the indicated transduced TC-1 cells. Bonferroni adjusted p-values are determined by two-sided student t test. The data shown here are from one representative experiment of two performed.

