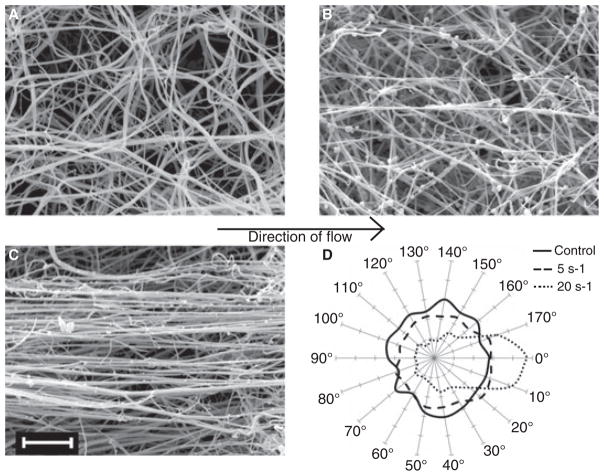
Fig. 1.
Scanning electron micrographs of clots formed under 0 s−1 (A), 5 s−1 (B) and 20 s−1 (C) shear. Micrographs were obtained at 5000× (magnification bar = 5 μm). Images are representative of 12 locations visualized on each clot from two to three experiments per condition. The direction of flow is from left to right, as shown by the arrow. This angle was considered 0°, and the orientation of each fiber in a set area was measured resulting in an angle from 0 to 180°. Measurements were placed in 10° bins and plotted on polar coordinates (D).

