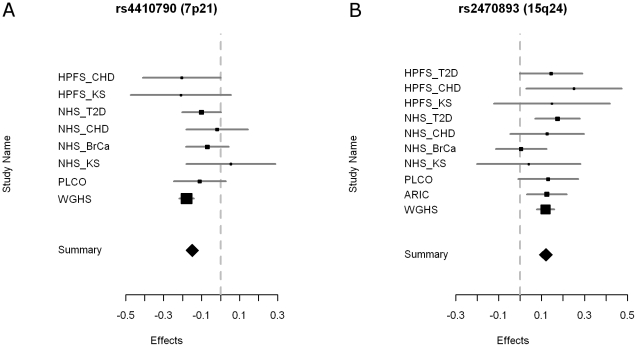
Figure 3. Forest plots of the meta-analysis for the two caffeine-associated loci.
A) rs4410790 and B) rs2470893. The contributing effect from each study is shown by a square, with confidence intervals indicated by horizontal lines. The contributing weight of each study to the meta-analysis is indicated by the size of the square. The meta-analysis estimate is shown at the bottom of each graph.

