Abstract
The purpose of this study is to optimize the dynamic Rb-82 cardiac PET acquisition and reconstruction protocols for maximum myocardial perfusion defect detection using realistic simulation data and task-based evaluation. Time activity curves (TACs) of different organs under both rest and stress conditions were extracted from dynamic Rb-82 PET images of five normal patients. Combined SimSET-GATE Monte Carlo simulation was used to generate nearly noise-free cardiac PET data from a time series of 3D NCAT phantoms with organ activities modeling different pre-scan delay times (PDTs) and total acquisition times (TATs). Poisson noise was added to the nearly noise-free projections and the OS-EM algorithm was applied to generate noisy reconstructed images. The channelized Hotelling observer (CHO) with 32×32 spatial templates corresponding to four octave-wide frequency channels was used to evaluate the images. The area under the ROC curve (AUC) was calculated from the CHO rating data as an index for image quality in terms of myocardial perfusion defect detection. The 0.5 cycle cm−1 Butterworth post-filtering on OS-EM (with 21 subsets) reconstructed images generates the highest AUC values while those from iteration numbers 1 to 4 do not show different AUC values. The optimized PDTs for both rest and stress conditions are found to be close to the cross points of the left ventricular chamber and myocardium TACs, which may promote an individualized PDT for patient data processing and image reconstruction. Shortening the TATs for <~3 min from the clinically employed acquisition time does not affect the myocardial perfusion defect detection significantly for both rest and stress studies.
1. Introduction
Myocardial perfusion PET contributes to the diagnosis of coronary artery disease (CAD) by providing perfusion and left ventricle function information in a single study. It has seen a significant recent gain in the clinical acceptance as a result of the developments in PET scanner technology and availability, along with its reimbursement and the commercial distribution of Rb-82 generators (Di Carli 2004, Di Carli and Hachamovitch 2006). The available evidence suggests that myocardial perfusion PET provides an accurate means for diagnosing obstructive CAD, which appears superior to SPECT, especially in obese patients and in patients undergoing pharmacologic stress (Di Carli et al 2007).
Despite its increased clinical popularity, there has been limited information on the statistical optimization of the Rb-82 PET acquisition or reconstruction protocols for a perfusion study. An empirical pre-scan delay time (PDT) of ~90 s has been suggested and employed in the clinic. It is widely considered optimal to leave out early phases with high activity in the blood pool when reconstructing cardiac images for diagnosis (Bacharach et al 2003). Ideally the longer the acquisition time (the shorter PDT), the higher the detected counts in the images and thus the higher the signal-to-noise ratio, which would lead to better detectability of perfusion abnormality. However, the earlier the PDT, the more the spillover from the blood chamber to the myocardium, which would deteriorate the contrast between normal and defect regions. The availability of list mode Rb-82 PET myocardial data in the clinic allows optimization of the acquisition and reconstruction protocols. The purpose of this study is to investigate the effects of Rb-82 PET myocardial image acquisition and reconstruction protocols on the detection of perfusion abnormality through realistic data simulations and task-based evaluation with a mathematical observer. The results suggest optimized data acquisition and reconstruction parameters for maximum detectability of myocardial defects in the Rb-82 PET studies.
2. Methods
2.1. Patient data collection
To perform realistic simulation, we sought through clinical cardiac Rb-82 PET/CT records of patients at the Johns Hopkins Hospital and located five patients with healthy myocardia. These patients had normal cardiac function, no perfusion defects, normal CT angiograms and zero calcium scores. In the clinic, the cardiac PET data acquisition starts at the same time as the injection of the Rb-82 chloride tracer and the total scan time interval is 8 min (Chander et al 2008). For each patient, the time activities of different organs including heart, liver, lungs, spleen and stomach were measured from the dynamic images taken during the entire data acquisition process under both the rest and stress conditions. For heart, the time activities of the myocardium and the left ventricular (LV) chamber were extracted.
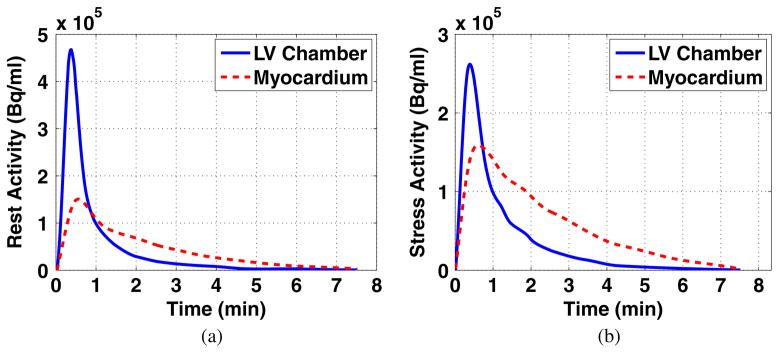
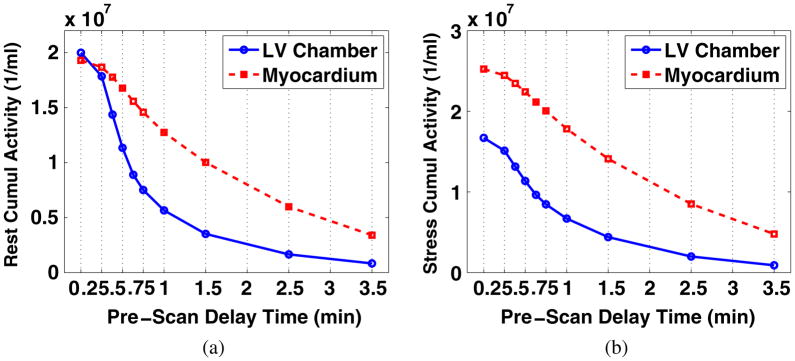
The organ time activity curves (TACs) of individual patients were cubic-spline smoothed and then averaged to generate a set of organ TACs representing the Rb-82 biodistribution in an average normal patient. The average TACs of the myocardium and LV chamber under rest and stress conditions are plotted in figure 1. Note that the time axis starts at the time when activity appears, which is ~0.5 min after the injection (not displayed).
Figure 1.
Smoothed TACs of the LV chamber and myocardium of an average normal patient under (a) rest and (b) stress conditions. The activities appear ~0.5 min after tracer injection (not displayed).
2.2. Monte Carlo simulation
We applied a Monte Carlo simulation tool (Shilov et al 2006) to generate a nearly noise-free Rb-82 myocardial perfusion sinogram dataset of individual organs using the 3D NCAT phantom (Segars et al 1999). This simulation tool combines the SimSET (simulation system for emission tomography) and the GATE (Geant4 application for emission tomography) codes, which are both well-validated Monte Carlo programs for emission computed tomography (Harrison et al 1993, Strul et al 2003). The photon propagation inside the voxelized NCAT phantom was simulated using SimSET from which the history file generated was passed to GATE for the GE Discovery RX PET/CT scanner geometry and detector circuitry simulation. The image degradation factors such as the positron range and photon non-collinearity were modeled in the SimSET simulation while the crystal size and detector penetration were modeled in the GATE simulation. The high-energy prompt gamma rays emitted were not simulated in the SimSET program1. The GE RX scanner uses LYSO crystals of dimensions 4.2 × 6.3 × 30 mm3 in the tangential, axial and radial directions and the LYSO crystals are arranged into 9 × 6 blocks. The scanner contains 24 rings and 630 crystals per ring, and is operated in the 2D data acquisition mode. The combined SimSET-GATE tool saves the simulation time by over 20 times as compared to using GATE alone, making the simulation for nearly noise-free datasets accomplishable.
To generate a nearly noise-free sinogram for each organ, the number of decays applied in the simulation was calculated based on the measured cumulated organ activity over the 8 min scan. The simulated dose (decay number) for each organ was 20 times of the measured cumulated organ activity times the NCAT organ volume. The generated nearly noise-free organ sinograms were ready to be scaled and summed to simulate different combinations of organ activities corresponding to any given PDT and total acquisition time (TAT).
2.3. Data generation and image reconstruction
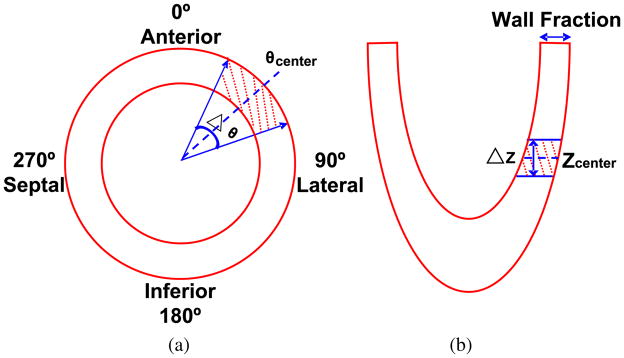
As described in the previous subsection, we used the nearly noise-free organ sinograms to generate simulated datasets corresponding to different PDTs and TATs. For a specified PDT, the cumulated activity for each organ was calculated by integrating the activity from the time when acquisition starts through the end of the TACs. The nearly noise-free organ sinograms were scaled based on the cumulated organ activities and then summed together. A Poisson noise generator was used to create 100 noise realizations of the simulated nearly noise-free sinogram for each PDT. Besides the normal myocardial perfusion sinograms described above, we also generated sinograms corresponding to a myocardium with a perfusion defect on the LV wall. This perfusion defect is a transmural defect spanning 40° over the anterior-lateral region and 1.5 cm over the long-axis direction (figure 2). The location of this defect was chosen to minimize the spillover effect from the right ventricular blood pool. The defect region has an activity that is 10% less than the normal activity. Similar to the sinograms corresponding to a normal heart, 100 noise realizations of defect sinograms were generated for each PDT.
Figure 2.
Schematic diagrams showing (a) short-axis and (b) long-axis views of the LV with the region of the perfusion defect shaded, θcenter = 45°, Δθ = 40°, ΔZ = 1.5 cm.
The sinogram datasets were reconstructed using the OS-EM algorithm we developed, which incorporated the deteriorating factor corrections to achieve performance comparable to the reconstruction software built on the GE RX scanner. The following procedures were included in the reconstruction process: (1) normalization; (2) attenuation correction: attenuation coefficient measured via forward projection of the 511 keV equivalent mu-maps, which were generated from the simulated attenuation images via bilinear scaling (Burger et al 2004); (3) randoms correction: randoms estimated from the crystal single rates and knowledge of the scanner’s timing coincidence window (Rahmim et al 2005); (4) scatter (in the object/patient) correction: using the single scatter simulation technique (Watson 2000); (5) decay correction, and (6) deadtime correction: deadtime estimated as a global scaling factor from the average ‘block busy’ information provided with the scanner. Normalization and attenuation corrections were incorporated in the system matrix, while estimated randoms and scattered events were incorporated in the denominator of the ordinary Poisson OS-EM iterative algorithm formula (Rahmim et al 2005), with the images finally scaled by global decay and deadtime factors. The number of subsets was set to 21 (as done in the clinic) and cubic voxels of size (3.27 mm)3 were utilized in the reconstructions. The reconstructed images were post-filtered using Butterworth low-pass filters with different cutoff frequencies.
After optimizing the PDT using methods described in the following subsections, normal and defect sinograms were generated for the optimized PDT but with different TATs by shortening the acquisition time from the end of the average patient TACs. These data were then reconstructed and post-filtered for TAT optimization.
2.4. Image evaluation criteria
Before performing task-based evaluation, mathematical criteria were used to evaluate the reconstructed images. The normalized standard deviation (NSD) and contrast were calculated for different PDTs. The NSD was computed from the reconstructed images with normal perfusion activity. It was calculated from a region over the LV wall of the noisy reconstructed images where the voxel intensity was relatively uniform:
| (1) |
where is the ith voxel value of the j th noise realization, x̄i is the ensemble mean value of the voxel i, n is the number of voxels in the region and m is the number of noise realizations. The contrast was calculated from noise-free sinogram-reconstructed images with perfusion defects. It was calculated from the defect region and a normal region of a similar area:
| (2) |
where x̄N and x̄D are the average values from the normal and defect regions, respectively. Similar to the NSD calculation, voxels close to the edges of the regions were not included to make sure that the voxels included have relative uniform values.
2.5. ROC analysis
Receiver operating characteristic (ROC) analysis was performed for every testing ensemble, i.e. normal and abnormal noisy cardiac images from a specific PDT and TAT, reconstruction iteration number and Butterworth filter cutoff frequency. To perform ROC analysis, ratings for the defect-present and defect-absent images need to be generated. A channelized Hotelling observer (CHO) with four octave-wide rotationally symmetric frequency channels was applied to the reconstructed images (processed as described below) to generate the ratings (Frey et al 2002). The start frequency and width of the first channel were both 1/64 cycles per pixel and the size of the channels was 32×32. The CHO templates in both the frequency and the spatial domains are shown in figure 3. This channel model was previously found to give good prediction of a human observer performance in a myocardial defect detection task (Wollenweber et al 1998).
Figure 3.
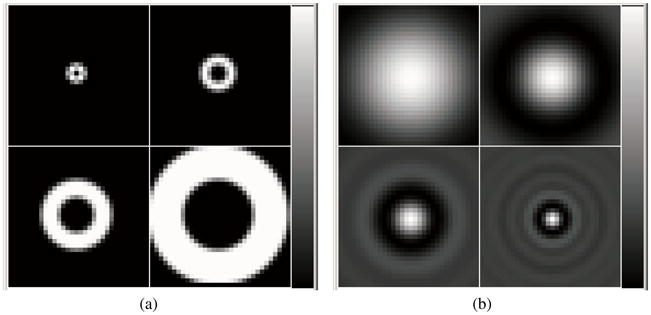
CHO templates in (a) frequency and (b) spatial domains.
Each of the reconstructed images was reoriented and the short-axis slice covering the centroid voxel of the perfusion defect region was cropped to the channel template size, with the centroid voxel at the center of the cropped image. The pixel values in the cropped short-axis images were then windowed by scaling the image so the maximum value in the heart was mapped to 255 and the resulting floating values were rounded to integers. This scaling and rounding was performed to duplicate what should be done to images used in a human observer study.
The leave-one-out strategy was applied in training and testing the observer (Metz 1986). For each pair of normal/abnormal image noise realization, the rest of all other noise realizations were used in training the CHO. This process was repeated for all the noise realizations in each testing ensemble. The resulting ratings acquired from the CHO were used to estimate ROC curves with the LABROC4 program (Metz et al 1990). This program estimates the parameters of the ROC curve, the AUC value and the standard deviations of these parameters.
3. Results
3.1. Optimization of iteration number and cutoff frequency
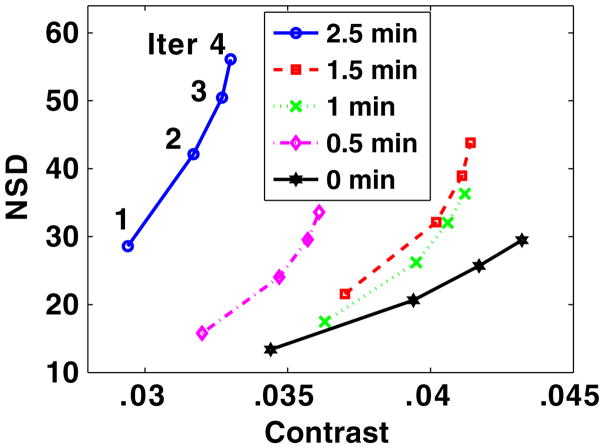
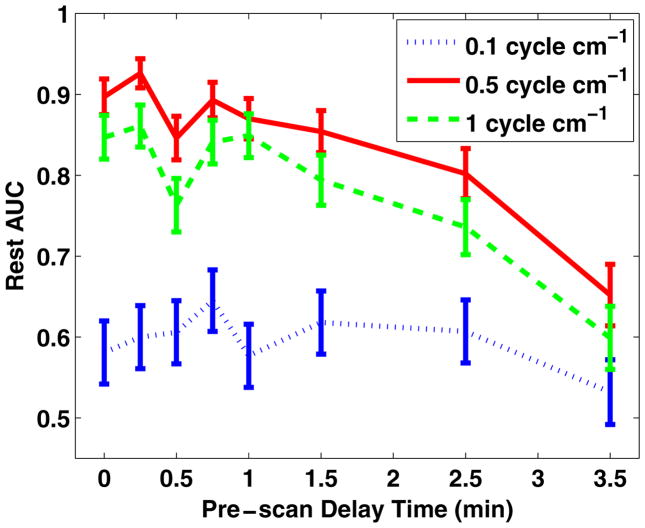
For the rest condition, we calculated the NSD and contrast for several PDTs from unfiltered images at iteration numbers from 1 to 4 of the OS-EM (with 21 subsets) reconstruction. The NSD versus contrast curves for different PDTs are plotted in figure 4. The images reconstructed with two iterations of the OS-EM algorithm (clinically employed) were Butterworth filtered at cutoff frequencies ranging from 0.1 cycle cm−1 to 1 cycle cm−1 (0.1 cycle cm−1 increments) before ROC analysis was performed. The AUC values in the myocardial perfusion defect detection task increase significantly as the cutoff frequency increases from 0.1 to 0.3 cycle cm−1 and they plateau when the cutoff frequency reaches 0.5 cycle cm−1. The AUC values for images from different PDTs with the cutoff frequency being 0.1, 0.5 and 1 cycle cm−1 are plotted in figure 5.
Figure 4.
NSD versus contrast plot for unfiltered images corresponding to different PDTs (0, 0.5, 1, 1.5 and 2.5 min), reconstruction iteration number (Iter) increasing from 1 to 4.
Figure 5.
AUC values (and standard deviations) for rest images from different PDTs, reconstructed with two iterations and Butterworth filtered with cutoff frequencies at 0.1, 0.5 and 1 cycle cm−1.
With the 0.5 cycle cm−1 cutoff frequency filtering, the AUC values were calculated from images reconstructed with different iteration numbers. It was found that the AUC values did not change from 1 to 4 iterations and then decreased at higher iterations. In the studies performed hereafter, iteration number 2 and the optimized cutoff frequency of 0.5 cycle cm−1 are employed for image reconstruction and post filtering.
From figure 4, it reads that the sequence in terms of better NSD versus contrast tradeoff (curve closer to the lower right corner) is PDT being 0, 1, 1.5, 0.5 and 2.5 min. Viewing the AUC values corresponding to these PDTs in figure 5 (the 0.5 cycle cm−1 curve), we notice that in general the better the NSD versus contrast tradeoff, the higher the resulting AUC values. This confirms that NSD versus contrast tradeoff as a reasonable preliminary mathematical criterion for image quality evaluation in terms of the myocardial perfusion defect detection task.
3.2. Optimization of pre-scan delay time
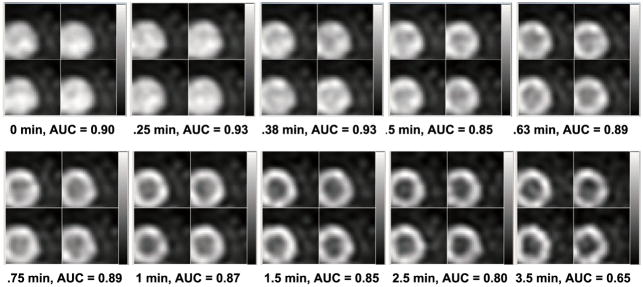
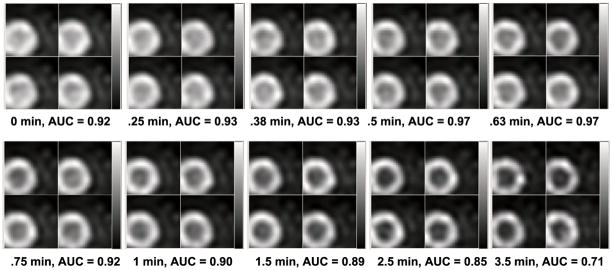
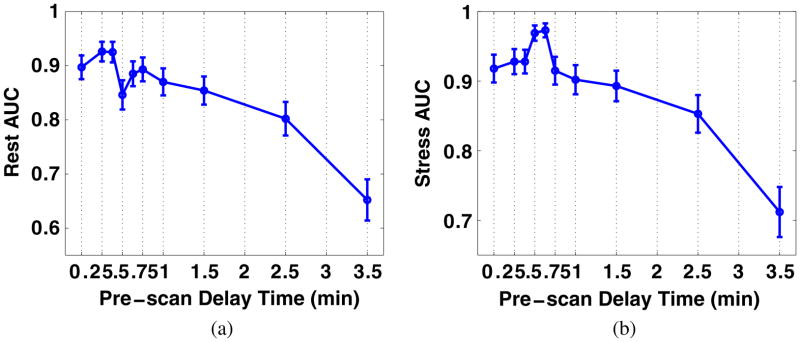
For both the rest and stress conditions, we performed ROC analysis and estimated AUC values for images corresponding to different PDTs (while for each PDT, the acquisition covers till the end of recorded activities). For each PDT, four noise realizations of the processed images with defects (for ROC analysis) are shown in figure 6 (at rest) and figure 7 (at stress) for a direct impression. More PDT samples are tested at the beginning of the TACs as the activities of the LV chamber and the myocardium fluctuate more. Two peaks are found for the rest study with results shown in figure 8(a) and one peak for the stress study results in figure 8(b). Reviewing figure 1, we notice that the second AUC peak for the rest study (at 45 s) and the peak for the stress study (at 38 s) occur around the cross points of the LV chamber and myocardium TACs. This provide valuable information for optimizing the PDT for individual patients. Counting the 30 s prior to the first appearance of detected counts, the optimized PDT we arrived at is shorter than the 90 s PDT generally applied in the clinic.
Figure 6.
Processed reconstructed rest images with the centroid of the defect in the center, four noise realizations shown for each PDT.
Figure 7.
Processed reconstructed stress images with the centroid of the defect in the center, four noise realizations shown for each PDT.
Figure 8.
AUC values (and standard deviations) for images with different PDTs under (a) rest and (b) stress conditions.
3.3. Optimization of total acquisition time
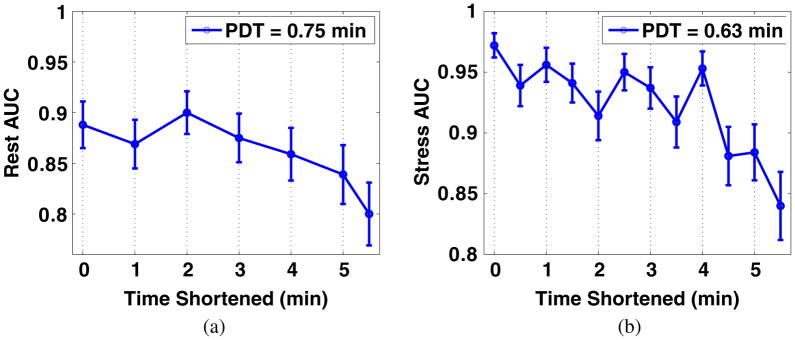
For the optimized PDTs of rest (at 0.75 min) and stress (at 0.63 min) studies, we calculated the AUCs for different shortened TATs. The reason we use the second peak of rest AUC (figure 8(a)) for TAT analysis is that the LV in images at earlier PDTs is almost uniform (figure 6), which has been avoided by physicians. The TATs were shortened from the end of TACs. As shown in figures 9(a) and (b), it is obvious that the AUCs are not significantly affected when reducing the TATs for <~3 min for both the rest and the stress studies.
Figure 9.
AUC values (and standard deviations) for images with optimized PDT and different TATs under (a) rest and (b) stress conditions.
4. Discussion
As discussed in subsection 3.2, two peaks are found in the AUC versus PDT curve for the rest study (figure 8(a)) while one is found for the stress study (figure 8(b)). As the images from which the AUC values were calculated carry cumulated activities from different PDTs, we plotted the cumulated activity versus PDT in figure 10. For the rest study, the cumulated activity of the LV chamber is higher than that of the myocardium at the beginning and falls lower as the PDT increases (figure 10(a)). For the stress study, the cumulated activity of the LV chamber is always lower than that of the myocardium for all the PDTs (figure 10(b)). Bearing this in mind, we observe that there are apparently two types of reconstructed rest images (figure 6), one with the LV looking like an almost uniform disk at the beginning and the other more like the donut shape later on. This may explain the two peaks (figure 8(a)), one for each type of images, in the AUC curve for the rest study.
Figure 10.
Cumulated activity of the LV chamber and myocardium of the average patient with different PDT under (a) rest and (b) stress conditions.
As for the stress condition, the LV always has chamber activity lower than the myocardium activity. The one peak happens where the noise level and the contrast between the chamber and myocardium activity reaches the best tradeoff. As known, the shorter a PDT, the more the cumulated counts and therefore higher the signal-to-noise ratio in the reconstructed images. At the same time, there is also more spillover from the LV chamber to the myocardium tissue as a result of the partial volume effect as well as scattering. This would affect the contrast between the normal and defect tissue and therefore the detectability of the perfusion defect. Improved partial volume correction through resolution modeling (Rahmim et al 2008) and accurate scatter correction may help better take advantage of the higher statistics at very short PDTs.
In practice, physicians are not used to viewing LV images with higher chamber activity than tissue activity. However, we notice that the first peak value in figure 8(a) is higher than the second one and more importantly that the AUC value with the PDT at 0 min is also higher than the second peak AUC value. It may be then meaningful to consider viewing the images with earlier PDTs although the chamber activity is higher, which have not been favored in the clinic. It is expected to be more the case with advanced scatter and partial volume correction and suggest consideration of change in paradigm. Further studies, especially human observer studies, will be performed to validate the findings here.
5. Conclusions
Through realistic simulation of Rb-82 cardiac PET data, we have studied the effect of the acquisition and reconstruction process on the myocardial perfusion defect detection using ROC analysis. It was found that the iteration number of the OS-EM algorithm (with 21 subsets) varying from 1 to 4 does not affect the AUC values, while the selection of the cutoff frequency of the Butterworth filter for postprocessing is critical. The cutoff frequency at ~0.5 cycle cm−1 produces images for the best myocardial perfusion defect detection based on ROC analysis. For both the rest and stress conditions, we optimized the PDT and found that the optimal PDT is close to the cross points of the TACs of the LV chamber and the myocardium. This information may be critical for implementing individualized imaging in the clinic for best myocardial perfusion defect detection. By studying the effect of shortening the TAT for the optimized PDT, we conclude that shortening the TAT for <~3 min from the total 8 min applied in the clinic does not affect myocardial perfusion defect detection significantly for both the rest and stress studies.
Acknowledgments
This work was supported by the National Institutes of Health under grant R01 EB000168. We thank Mr Robert Harrison for consultation on the SimSET program.
Footnotes
There has been a limited study on modeling the presence of high-energy (776 keV) prompt gamma rays within Monte Carlo PET simulations (Zhu and El Fakhri 2007), which explains its absence in the SimSET program. These high-energy gamma rays occur as 13% of the β+ decays of Rb-82, a portion of which is detected within the 511 keV energy window due to the limited energy resolution. The detected prompt gamma rays produce a wide-angle true coincidence background that has been mainly a concern in the quantification of myocardial perfusion with Rb-82 PET images. Watson et al (2008) developed a prompt gamma correction technique and demonstrated improved quantitative accuracy. The study presented here instead focuses on acquisition protocol optimization, in which the absence of prompt gamma simulation is not expected to noticeably affect the results. Nevertheless, further investigation involving simulation program development will be pursued to study the effect of prompt gammas on perfusion defect detection.
References
- Bacharach SL, Bax JJ, Case J, Delbeke D, Kurdziel KA, Martin WH, Patterson RE. PET myocardial glucose metabolism and perfusion imaging: I. Guidelines for patient preparation and data acquisition. J Nucl Cardiol. 2003;10:543–54. doi: 10.1016/s1071-3581(03)00648-2. [DOI] [PubMed] [Google Scholar]
- Burger C, Goerres G, Schoenes S, Lonn A, von Schulthess G. PET attenuation coefficients from CT images: experimental evaluation of the transformation of CT into PET 511-keV attenuation coefficients. Eur J Nucl Med. 2004;29:922–7. doi: 10.1007/s00259-002-0796-3. [DOI] [PubMed] [Google Scholar]
- Chander A, Brenner M, Lautamäki R, Voicu C, Merrill J, Bengel FM. Comparison of measures of left ventricular function from electrocardiographically gated 82Rb PET with contrast-enhanced CT ventriculography: a hybrid PET/CT analysis. J Nucl Med. 2008;49:1643–50. doi: 10.2967/jnumed.108.053819. [DOI] [PubMed] [Google Scholar]
- Di Carli MF. Advances in positron emission tomography. J Nucl Cardiol. 2004;11:719–32. doi: 10.1016/j.nuclcard.2004.09.007. [DOI] [PubMed] [Google Scholar]
- Di Carli MF, Dorbala S, Meserve J, El Fakhri G, Sitek A, Moore SC. Clinical myocardial perfusion PET/CT. J Nucl Med. 2007;48:783–93. doi: 10.2967/jnumed.106.032789. [DOI] [PubMed] [Google Scholar]
- Di Carli MF, Hachamovitch R. Should PET replace SPECT for evaluating CAD? The end of the beginning. J Nucl Cardiol. 2006;13:2–7. doi: 10.1016/j.nuclcard.2005.12.001. [DOI] [PubMed] [Google Scholar]
- Frey EC, Gilland KL, Tsui BMW. Application of task-based measures of image quality to optimization and evaluation of three-dimensional reconstruction-based compensation methods in myocardial perfusion SPECT. IEEE Trans Med Imaging. 2002;21:1040–50. doi: 10.1109/TMI.2002.804437. [DOI] [PubMed] [Google Scholar]
- Harrison RL, Vannoy SD, Haynor DR, Gillispie SB, Kaplan MS, Lewellen TK. Preliminary experience with the photon history generator module of a public-domain simulation system for emission tomography. IEEE Nucl Sci Symp Med Imaging Conf Rec. 1993;2:1154–8. [Google Scholar]
- Metz CE. ROC methodology in radiologic imaging. Invest Radiol. 1986;21:720–33. doi: 10.1097/00004424-198609000-00009. [DOI] [PubMed] [Google Scholar]
- Metz CE, Shen JH, Herman BA. New methods for estimating a binormal ROC curve from continuously distributed test results. Ann. Meeting of the American Statistical Association; Anaheim, CA. 1990. [Google Scholar]
- Rahmim A, Cheng JC, Blinder S, Camborde M-L, Sossi V. Statistical dynamic image reconstruction in state-of-the-art high resolution PET. Phys Med Biol. 2005;50:4887–912. doi: 10.1088/0031-9155/50/20/010. [DOI] [PubMed] [Google Scholar]
- Rahmim A, Tang J, Lodge MA, Lashkari S, Ay MR, Lautamäki R, Tsui BMW, Bengel FM. Analytic system matrix resolution modeling in PET: an application to Rb-82 cardiac imaging. Phys Med Biol. 2008;53:5947–65. doi: 10.1088/0031-9155/53/21/004. [DOI] [PMC free article] [PubMed] [Google Scholar]
- Segars WP, Lalush DS, Tsui BMW. A realistic spline-based dynamic heart phantom. IEEE Trans Nucl Sci. 1999;46:503–6. [Google Scholar]
- Shilov MA, Frey EC, Segars WP, Xu J, Tsui BMW. Improved Monte-Carlo simulations for dynamic PET. J Nucl Med. 2006;47:197. [Google Scholar]
- Strul D, Santin G, Lazaro D, Breton V, Morel C. GATE (Geant4 application for tomographic emission): a PET/SPECT general-purpose simulation platform. Nucl Phys B. 2003;125:75–9. [Google Scholar]
- Watson CC. New, faster, image-based scatter correction for 3D PET. IEEE Trans Nucl Sci. 2000;47:1587–94. [Google Scholar]
- Watson C, Hayden C, Casey M, Hamill J, Bendriem B. Prompt gamma correction for improved quantification in 82Rb PET. J Nucl Med. 2008;49:64P. [Google Scholar]
- Wollenweber SD, Tsui BMW, Frey EC, Lalush DS, LaCroix KJ. Comparison of human and channelized Hotelling observers in myocardial defect detection in SPECT. J Nucl Med. 1998;39:771A. [Google Scholar]
- Zhu X, El Fakhri G. Feasibility of quantitative Y-86 PET: impact of accurate modeling of cascade gamma rays and scatter correction. IEEE Nucl. Sci. Symp. Med. Imaging Conf; Honolulu, HI. 2007. [Google Scholar]


